Enbridge (TSX:ENB)
Price and Volume
Detailed Quote| Volume | 8,673,208 |
| Open | 65.52 |
| Bid (Size) | 65.65 (1) |
| Ask (Size) | 65.70 (2) |
| Prev. Close | 65.54 |
| Today's Range | 64.86 - 66.11 |
| 52wk Range | 62.42 - 80.65 |
| Shares Outstanding | N/A |
| Dividend Yield | N/A |
Top News
More News

Performance
52-Week Range
18.6% below 52-week high
65.65
62.4252W Low
80.6552W High
1 Week
1.4% below 1-week high
64.861W Low
66.551W High
Enbridge (ENB) traded between $62.42 and $80.65 over the past 52 weeks and last traded at $65.65, 18.6% below its 52-week high. Over the past week it ranged between $64.86 and $66.55.
Past 12 Months
1W
-$0.56
1M
-$4.04
3M
-$10.26
6M
-$9.13
YTD
-$0.41
1Y
-$3.78
ENB was -5.4% over the past year, -12.2% over six months, -0.6% year to date, -0.8% in the last week.
12 Months vs Market
ENB
-5.4%
DIA
+9.7%
SPY
+15.4%
QQQ
+24.4%
IWM
+14.8%
Over the past 12 months ENB returned -5.4% versus DIA (Dow) +9.7%, SPY (S&P 500) +15.4%, QQQ (Nasdaq 100) +24.4% and IWM (Russell 2000) +14.8%.
Volume & Liquidity
1.04× 3-mo avg
Today 8,673,208
3-mo avg 8.4M
1W
5.8M
1M
8.3M
3M
8.4M
6M
8.2M
YTD
8.2M
1Y
7.9M
ENB most recently traded 8,673,208 shares against a 3-month average daily volume of 8.4M.
More News
Read More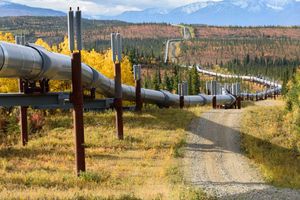
Here’s the 5.9% Dividend Stock I Can’t Get Enough Of ↗
October 01, 2026
Dividend Investors: 2 Discounted TSX Stocks to Consider Now ↗
September 30, 2026

2 Slam-Dunk Dividend Stocks to Buy Now ↗
September 30, 2026

Here’s What $250,000 in the Right Stocks Could Pay You Every Month ↗
September 30, 2026

5 TSX Stocks to Buy With $50,000 for Retirement Income ↗
September 29, 2026

Buy The Dip: 1 TSX Dividend Giant Now on Sale ↗
September 29, 2026

4 TSX Stocks to Buy With $20,000 for Passive Income ↗
September 29, 2026

3 High-Yield TSX Stocks to Consider Now if You Have $7,500 to Invest ↗
September 29, 2026

This Top TSX Dividend Stock is Down 17%: Should You Buy Now or Wait? ↗
September 28, 2026

I’m Locking These 3 Dividend Stocks Into My TFSA for the Long Run ↗
September 27, 2026

The Stock That Could Pay for Your Kids’ Education if You Start Today ↗
September 26, 2026

Why This 5.9% Canadian Dividend Stock Deserves a Spot in Your TFSA Today ↗
September 26, 2026

Enbridge: My Honest ‘Buy, Sell or Hold’ Take on the Stock ↗
September 25, 2026

Are These Still the Best Dividend Stocks in Canada? ↗
September 24, 2026

I Love Buying Enbridge Stock on Sale, and It’s on Sale Now ↗
September 21, 2026
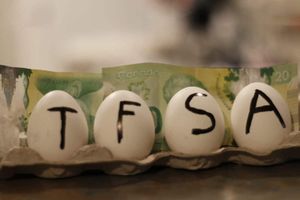
I Plan to Keep These Stocks in My TFSA for at Least 10 Years ↗
September 21, 2026

5 Dividend Stocks I’d Trust to Keep Paying Me No Matter What ↗
September 21, 2026

The Canadian Dividend Stock I’d Trust for the Next 20 Years ↗
September 20, 2026

Enbridge Stock: Buy, Sell, or Hold With the CEO Retiring? ↗
September 18, 2026

2 Great Canadian Dividend Stocks That Just Raised Their Payouts Again ↗
September 18, 2026

While Interest Rates Sit Still, These 2 Dividend Giants Look Good ↗
September 18, 2026

TSX Dividend Stocks That Keep Paying No Matter What the Market Does ↗
September 17, 2026

Enbridge Is Solid, But This Stock Offers More Upside ↗
September 16, 2026
Frequently Asked Questions
Is Enbridge publicly traded?
Yes, Enbridge is publicly traded.
What exchange does Enbridge trade on?
Enbridge trades on the Toronto Stock Exchange
What is the ticker symbol for Enbridge ?
The ticker symbol for Enbridge is ENB on the Toronto Stock Exchange
What is the current price of Enbridge ?
The current price of Enbridge is 65.65
When was Enbridge last traded?
The last trade of Enbridge was at 10/05/26 04:00 PM ET
Stock Quote API & Stock News API supplied by www.cloudquote.io
Quotes delayed at least 20 minutes.
By accessing this page, you agree to the Privacy Policy and Terms Of Service.
Quotes delayed at least 20 minutes.
By accessing this page, you agree to the Privacy Policy and Terms Of Service.
© 2025 FinancialContent. All rights reserved.