Apple Inc. (AAPL), headquartered in Cupertino, California, remains a leading force in the global technology sector. The company designs, manufactures, and markets smartphones, personal computers, tablets, wearables, and accessories. With a market cap of $4.5 trillion, Apple also offers payment, digital content, cloud and advertising services primarily in consumer, small & mid-sized business, education, enterprise and government markets worldwide.
Companies worth $200 billion or more are generally described as “mega-cap stocks,” and AAPL definitely fits that description, with its market cap exceeding this threshold, reflecting its substantial size, influence, and dominance in the consumer electronics industry. Apple revolutionized personal technology leading the world in innovation with iPhone, iPad, Mac, AirPods, Apple Watch, and Apple Vision Pro, providing seamless experiences across all Apple devices and empowering people with breakthrough services.
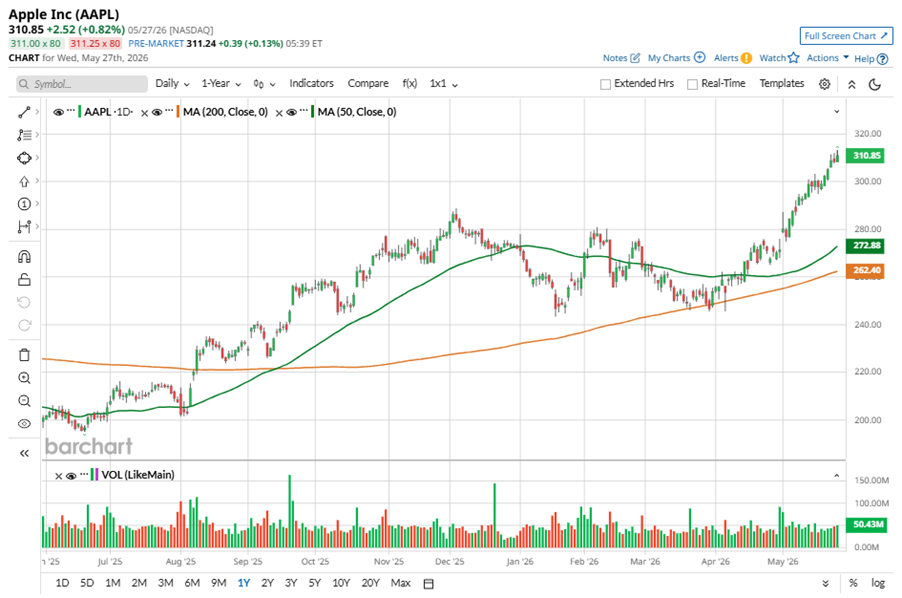
Despite its notable strength, AAPL shares touched their 52-week high of $313.26 in the last trading session. Over the past three months, AAPL stock has gained 17.7%, underperforming the State Street Technology Select Sector SPDR ETF’s (XLK) 32.9% gains during the same time frame.
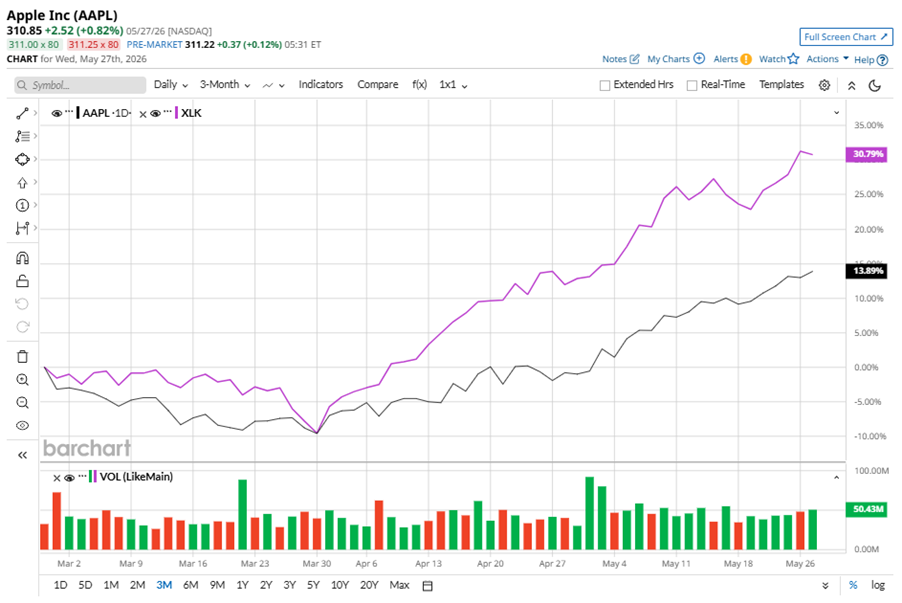
Shares of AAPL climbed 14.3% on a YTD basis and rose 55.3% over the past 52 weeks, underperforming XLK’s YTD gains of 28.1% and 58.9% returns over the last year.
To confirm the bullish trend, AAPL has been trading above its 50-day moving average since mid-April. The stock is trading above its 200-day moving average since early August, 2025, with slight fluctuations.
Rising component costs for AAPL, driven by higher memory prices, are likely to become a significant headwind.
On Apr. 30, AAPL reported its Q2 results, and its shares closed up more than 3% in the following trading session. Its EPS of $2.01 beat Wall Street expectations of $1.92. The company’s revenue was $111.2 billion, exceeding Wall Street forecasts of $109.5 billion.
In the competitive arena of consumer electronics, Sony Group Corporation (SONY) has lagged behind Apple, with a 14.6% downtick on a YTD basis and a 17.7% loss over the past 52 weeks.
Wall Street analysts are reasonably bullish on AAPL’s prospects. The stock has a consensus “Moderate Buy” rating from the 42 analysts covering it. While AAPL currently trades above its mean price target of $308.19, the Street-high price target of $400 suggests a 28.7% upside potential.
On the date of publication, Neha Panjwani did not have (either directly or indirectly) positions in any of the securities mentioned in this article. All information and data in this article is solely for informational purposes. For more information please view the Barchart Disclosure Policy here.
More news from Barchart
- TSMC CEO Promises Staff Massive 30% Bonus Bump as Profits Surge. This Is a Clear Message for TSM Stock Bulls.
- 2 Warren Buffett-Inspired Fund Managers Disagree on Amazon Stock, and Why I’m Staying on the Sidelines Here
- RBC Just Upped Its Price Target on Marvell Technology Stock. Here's Why
- Why is the VIX So Low?