Robust margins drive record free cash flow of over $600 million
On track for $650 million in return of capital to shareholders in 2025
Development projects advancing on plan
TORONTO, July 30, 2025 (GLOBE NEWSWIRE) -- Kinross Gold Corporation (TSX: K, NYSE: KGC) (“Kinross” or the “Company”) today announced its results for the second quarter ended June 30, 2025.
This news release contains forward-looking information about expected future events and financial and operating performance of the Company. We refer to the risks and assumptions set out in our Cautionary Statement on Forward-Looking Information located on pages 25 and 26 of this release. All dollar amounts are expressed in U.S. dollars, unless otherwise noted.
2025 second-quarter highlights:
- Production1 of 512,574 gold equivalent ounces (Au eq. oz.).
- Production cost of sales2 of $1,080 per Au eq. oz. sold and attributable production cost of sales1 of $1,074 per Au eq. oz. sold.
- Attributable all-in sustaining cost1 of $1,493 per Au eq. oz. sold.
- Operating cash flow3 of $992.4 million.
- Attributable free cash flow1 record of $646.6 million.
- Margins4 increased by 68% to $2,204 per Au eq. oz. sold compared with Q2 2024, significantly outpacing the rise in the average realized gold price.
- Reported earnings5 of $530.7 million, or $0.43 per share, with adjusted net earnings6 of $541.0 million, or $0.44 per share.
- On track to meet annual guidance: On an attributable basis1, Kinross expects to produce 2.0 million Au eq. oz. (+/- 5%) at a production cost of sales per Au eq. oz.1 of $1,120 (+/- 5%) and all-in sustaining cost1 of $1,500 (+/- 5%) per ounce sold. Total attributable capital expenditures1 are forecast to be $1,150 million (+/- 5%).
- Cash and cash equivalents of $1,136.5 million, and total liquidity7 of approximately $2.8 billion at June 30, 2025, as both increased significantly quarter-over-quarter.
Return of capital to shareholders:
- Since reactivating its share buyback program in April 2025, the Company has re-purchased approximately $225 million in shares to date of the $500 million minimum planned for 2025.
- Including its quarterly dividend, Kinross has returned approximately $300 million in capital to shareholders year-to-date.
- Kinross’ Board of Directors declared a quarterly dividend of $0.03 per common share payable on September 4, 2025, to shareholders of record at the close of business on August 21, 2025.
Operations highlights:
- Paracatu continued its strong performance and was the highest producing mine in the portfolio.
- The Tasiast mill is performing well and on track to meet full-year guidance. Mining at the Fennec satellite deposit has commenced.
- Bald Mountain had a strong quarter, with higher production and lower cost of sales per ounce sold both quarter-over-quarter and year-over-year.
Development and exploration projects:
- Great Bear’s Advanced Exploration (AEX) program is progressing on schedule, with construction of surface facilities well underway. For the Main Project, detailed engineering for key infrastructure is advancing well and initial procurement activities have commenced.
- At Round Mountain Phase X, the exploration decline has advanced, with over 4,500 metres developed to date. Underground drilling has progressed well, with results showing strong widths and grades in both the upper and lower exploration targets, and indicating continuation of mineralization down dip outside the original exploration target. Technical studies and detailed engineering are also progressing well.
- At Curlew, drilling continues to intersect high grades and strong widths that could support high-margin production. Extension of the underground declines to target additional high-grade zones is also progressing with over 800 metres developed year-to-date.
- At Lobo-Marte, the dedicated project team continues to progress baseline studies to support permitting.
CEO commentary:
J. Paul Rollinson, CEO, made the following comments in relation to 2025 second-quarter results:
“Our portfolio of mines continued to perform well during the quarter contributing to a strong first half of the year and positioning us well to achieve our full-year guidance. The Company delivered a 21% increase in margins of $2,204 compared with Q1 2025, outpacing the 15% increase in the gold price over the same period. We also delivered record free cash flow of approximately $650 million, which increased by 74% compared with the previous quarter.
“Since reactivating our share buyback program earlier this year, we have repurchased $225 million in shares of the $500 million planned for the year, while maintaining our quarterly dividend and significantly strengthening our investment-grade balance sheet.
“We are excited about our pipeline of high-quality development and exploration projects, all of which progressed well during the quarter. We have strong optionality in our substantial resource base and are focused on drilling, technical studies and permitting to advance longer-dated projects into our production profile to extend mine life, with a focus on driving margin growth.
“We are also pleased to have released our 2024 Sustainability Report during the quarter, which provides a transparent and comprehensive account of our reporting in this important area. We continue to be focused on sustainability across all aspects of our business, from operations and growth projects, to exploration and strategic priorities.”
Summary of financial and operating results
| Three months ended | Six months ended | ||||||||||||
| June 30, | June 30, | ||||||||||||
| (in millions of U.S. dollars, except ounces, per share amounts, and per ounce amounts) | 2025 | 2024 | 2025 | 2024 | |||||||||
| Operating Highlights(a) | |||||||||||||
| Total gold equivalent ounces(b) | |||||||||||||
| Produced | 530,077 | 535,338 | 1,059,938 | 1,062,737 | |||||||||
| Sold | 526,223 | 520,760 | 1,050,312 | 1,043,160 | |||||||||
| Attributable gold equivalent ounces(b) | |||||||||||||
| Produced | 512,574 | 535,338 | 1,024,662 | 1,062,737 | |||||||||
| Sold | 508,300 | 520,760 | 1,014,864 | 1,043,160 | |||||||||
| Gold ounces - sold | 519,391 | 505,122 | 1,035,659 | 1,008,726 | |||||||||
| Silver ounces - sold (000's) | 666 | 1,268 | 1,367 | 2,935 | |||||||||
| Earnings(a) | |||||||||||||
| Metal sales | $ | 1,728.5 | $ | 1,219.5 | $ | 3,226.0 | $ | 2,301.0 | |||||
| Production cost of sales | $ | 568.4 | $ | 536.1 | $ | 1,115.1 | $ | 1,049.0 | |||||
| Depreciation, depletion and amortization | $ | 262.9 | $ | 295.8 | $ | 551.3 | $ | 566.5 | |||||
| Operating earnings | $ | 774.8 | $ | 298.3 | $ | 1,345.2 | $ | 491.5 | |||||
| Net earnings attributable to common shareholders | $ | 530.7 | $ | 210.9 | $ | 898.7 | $ | 317.9 | |||||
| Net earnings per share attributable to common shareholders (basic and diluted) | $ | 0.43 | $ | 0.17 | $ | 0.73 | $ | 0.26 | |||||
| Adjusted net earnings(c) | $ | 541.0 | $ | 174.7 | $ | 905.0 | $ | 299.6 | |||||
| Adjusted net earnings per share(c) | $ | 0.44 | $ | 0.14 | $ | 0.74 | $ | 0.24 | |||||
| Cash Flow(a) | |||||||||||||
| Net cash flow provided from operating activities | $ | 992.4 | $ | 604.0 | $ | 1,589.5 | $ | 978.4 | |||||
| Attributable adjusted operating cash flow(c) | $ | 843.9 | $ | 478.3 | $ | 1,520.1 | $ | 904.0 | |||||
| Capital expenditures(d) | $ | 306.1 | $ | 274.2 | $ | 513.8 | $ | 516.1 | |||||
| Attributable capital expenditures(c) | $ | 301.8 | $ | 264.5 | $ | 505.9 | $ | 496.6 | |||||
| Attributable free cash flow(c) | $ | 646.6 | $ | 345.9 | $ | 1,017.4 | $ | 491.2 | |||||
| Per Ounce Metrics(a) | |||||||||||||
| Average realized gold price per ounce(e) | $ | 3,284 | $ | 2,342 | $ | 3,071 | $ | 2,206 | |||||
| Attributable average realized gold price per ounce(c) | $ | 3,285 | $ | 2,342 | $ | 3,071 | $ | 2,206 | |||||
| Production cost of sales per equivalent ounce sold(b)(f) | $ | 1,080 | $ | 1,029 | $ | 1,062 | $ | 1,006 | |||||
| Attributable production cost of sales per equivalent ounce sold(b)(c) | $ | 1,074 | $ | 1,029 | $ | 1,056 | $ | 1,006 | |||||
| Attributable production cost of sales per ounce sold on a by-product basis(c) | $ | 1,044 | $ | 989 | $ | 1,027 | $ | 965 | |||||
| Attributable all-in sustaining cost per equivalent ounce sold(b)(c) | $ | 1,493 | $ | 1,387 | $ | 1,424 | $ | 1,348 | |||||
| Attributable all-in sustaining cost per ounce sold on a by-product basis(c) | $ | 1,469 | $ | 1,357 | $ | 1,400 | $ | 1,319 | |||||
| Attributable all-in cost per equivalent ounce sold(b)(c) | $ | 1,936 | $ | 1,774 | $ | 1,808 | $ | 1,702 | |||||
| Attributable all-in cost per ounce sold on a by-product basis(c) | $ | 1,918 | $ | 1,756 | $ | 1,789 | $ | 1,685 | |||||
| (a) | All measures and ratios include 100% of the results from Manh Choh, except measures and ratios denoted as “attributable.” “Attributable” measures and ratios include Kinross’ 70% share of Manh Choh production, sales, cash flow, capital expenditures and costs, as applicable. | |
| (b) | “Gold equivalent ounces” include silver ounces produced and sold converted to a gold equivalent based on a ratio of the average spot market prices for the commodities for each period. The ratio for the second quarter and first six months of 2025 was 97.41:1 and 93.60:1, respectively (second quarter and first six months of 2024 – 81.06:1 and 84.51:1, respectively). | |
| (c) | The definition and reconciliation of these non-GAAP financial measures and ratios is included on pages 16 to 21 of this news release. Non-GAAP financial measures and ratios have no standardized meaning under International Financial Reporting Standards (“IFRS”) and therefore, may not be comparable to similar measures presented by other issuers. | |
| (d) | “Capital expenditures” is as reported as “Additions to property, plant and equipment” on the interim condensed consolidated statements of cash flows. | |
| (e) | “Average realized gold price per ounce” is defined as gold revenue divided by total gold ounces sold. | |
| (f) | “Production cost of sales per equivalent ounce sold” is defined as production cost of sales divided by total gold equivalent ounces sold. | |
The following operating and financial results are based on second-quarter gold equivalent production:
Production: Kinross produced 512,574 Au eq. oz. in Q2 2025, compared with 535,338 Au eq. oz. in Q2 2024. Higher production from Fort Knox, with the commencement of higher-grade, higher-recovery ore feed from Manh Choh in the second half of 2024, and higher production from Paracatu, was offset by lower production from Tasiast and Round Mountain, as planned.
Average realized gold price8: The average realized gold price in Q2 2025 was $3,284 per ounce, compared with $2,342 per ounce in Q2 2024.
Revenue: During the second quarter, revenue increased to $1,728.5 million, compared with $1,219.5 million during Q2 2024. The 42% year-over-year increase is due to the increase in the average realized gold price.
Production cost of sales: Production cost of sales per Au eq. oz. sold2 was $1,080 for the quarter, compared with $1,029 in Q2 2024. Attributable production cost of sales per Au eq. oz. sold1 was $1,074 for the quarter, compared with $1,029 in Q2 2024.
Attributable production cost of sales per Au oz. sold on a by-product basis1 was $1,044 in Q2 2025, compared with $989 in Q2 2024, based on attributable gold sales of 501,628 ounces and attributable silver sales of 650,026 ounces.
Margins4: Kinross’ margin per Au eq. oz. sold increased by 68% to $2,204 for Q2 2025, compared with the Q2 2024 margin of $1,313, outpacing the 40% increase in average realized gold price.
Attributable all-in sustaining cost1: Attributable all-in sustaining cost per Au eq. oz. sold was $1,493 in Q2 2025, compared with $1,387 in Q2 2024.
In Q2 2025, attributable all-in sustaining cost per Au oz. sold on a by-product basis was $1,469, compared with $1,357 in Q2 2024.
Operating cash flow3: Operating cash flow increased to $992.4 million for Q2 2025, compared with $604.0 million for Q2 2024.
Attributable adjusted operating cash flow1 for Q2 2025 increased to $843.9 million, compared with $478.3 million for Q2 2024.
Attributable free cash flow1: Attributable free cash flow increased by 87% to $646.6 million in Q2 2025, compared with $345.9 million in Q2 2024.
Reported earnings5: Reported net earnings more than doubled to $530.7 million for Q2 2025, or $0.43 per share, compared with reported net earnings of $210.9 million, or $0.17 per share, for Q2 2024.
Adjusted net earnings6 more than tripled to $541.0 million, or $0.44 per share, for Q2 2025, compared with $174.7, or $0.14 per share, for Q2 2024.
Attributable capital expenditures1: Attributable capital expenditures increased to $301.8 million for Q2 2025, compared with $264.5 million for Q2 2024. The increase was driven by the ramp-up of development activities at Great Bear, Bald Mountain Redbird Phase 1 and La Coipa Phase 7, partially offset by lower spending on capital development due to mine sequencing at Fort Knox and Manh Choh.
Balance sheet
As of June 30, 2025, Kinross had cash and cash equivalents of $1,136.5 million, compared with $694.6 million at March 31, 2025, and net debt9 of approximately $100 million.
The Company had additional available credit10 of $1.6 billion and total liquidity7 of approximately $2.8 billion as of June 30, 2025.
Return of capital to shareholders
Reflecting the Company’s financial strength, Kinross reactivated its share buyback program in April 2025, while continuing its quarterly dividend program.
Kinross repurchased approximately $170 million in shares during the quarter, and approximately $225 million to date (representing 15.2 million shares). Including its quarterly dividend, Kinross has returned approximately $300 million in capital to shareholders to date in 2025.
Kinross continues to target returning a minimum of $650 million to shareholders for the full year, including a minimum of $500 million in share repurchases.
As part of its continuing quarterly dividend program, the Company declared a dividend of $0.03 per common share payable on September 4, 2025, to shareholders of record as of August 21, 2025.
Operating results
Mine-by-mine summaries for 2025 second-quarter operating results may be found on pages 10 and 14 of this news release. Highlights include the following:
At Tasiast, production decreased quarter-over-quarter and year-over-year driven by planned lower grades and lower throughput. The higher recoveries following a number of optimization initiatives to the mill were partially offset by planned lower grades year-over-year. Cost of sales per ounce sold increased compared with the previous quarter and Q2 2024 due to lower production. Tasiast remains on track to meet its annual guidance.
Production at Paracatu increased quarter-over-quarter due to higher throughput, partially offset by lower grades. Year-over-year production increased due to higher grades and recoveries partially offset by an expected decrease in throughput, as per planned mine sequencing which moved into harder, higher-grade ore this year. Cost of sales per ounce sold was in line with the previous quarter and decreased compared with Q2 2024 due to the increase in production.
At La Coipa, production increased quarter-over-quarter due to timing of ounces processed through the mill, partially offset by lower grades as a result of decreased ore tonnes mined from the pit and increased feed from low-grade stockpiles driven by higher groundwater inflows into the pits than anticipated. Relative to Q2 2024, production decreased also due to lower grades with higher feed from low-grade stockpiles. In the second half of the year, production is expected to increase as mining transitions to higher-grade ore from Phase 7, and the mine remains on track to meet its annual production guidance. Cost of sales per ounce sold was higher quarter-over-quarter as a result of the lower grades and higher royalty costs, and year-over-year as a result of the decrease in production and higher royalty, labour and contractor costs. Permitting work for mine life extensions continues, including the submission of the Environmental Impact Assessment during the quarter.
At Fort Knox, production was largely in line quarter-over-quarter, and increased year-over-year as a result of the contribution of Manh Choh’s higher-grade, higher-recovery ore starting in the second half of 2024. Cost of sales per ounce sold increased quarter-over-quarter due to higher processing costs and the timing of ounces recovered from the heap leach pads. Year-over-year costs decreased as a result of the increase in production, partially offset by higher royalty and reagent costs related largely to the start of Manh Choh production.
At Round Mountain, production was higher quarter-over-quarter driven by higher grades. Production decreased year-over-year as a result of lower mill grades and fewer ounces recovered from the heap leach pads as per planned mine sequencing as the site transitions from Phase W to Phase S.
At Bald Mountain, production was higher quarter-over-quarter and year-over-year largely as a result of strong grades and timing of ounces recovered from the heap leach pads, partially offset by fewer tonnes of ore stacked. Cost of sales per ounce sold was lower quarter-over-quarter and year-over-year as a result of the increase in production and higher proportion of capital development tonnes as mining at Redbird Phase I continues to ramp-up.
Development and exploration projects
Great Bear
At Great Bear, Kinross continues to progress its AEX program, permitting and detailed engineering for the Main Project.
AEX construction commenced in Q4 2024, earthwork activities are underway, and the AEX camp is nearing completion. Initial development of the exploration decline is on target for December 2025, subject to permitting.
For the Main Project, Kinross is progressing detailed engineering on the mill, the tailings management facility, and other site infrastructure. Initial procurement activities for major process equipment have commenced, with awards planned to start in late 2025, and manufacturing for a few long lead items is expected to commence in 2026.
In order to advance the Impact Statement (IS) on a timely basis, the Company is coordinating with the Impact Assessment Agency of Canada (IAAC) on a staged filing process. The Company intends to file the majority of the technical chapters by year end and the remaining chapters by the end of Q1 2026. This approach will underpin a robust IS filing with the necessary technical and Indigenous contributions to help facilitate an efficient review process by IAAC.
Kinross also advanced its regional exploration drilling program during the quarter, targeting favorable geophysical signatures as well as lithological contacts, looking for new, near-surface mineralization.
Round Mountain Phase X
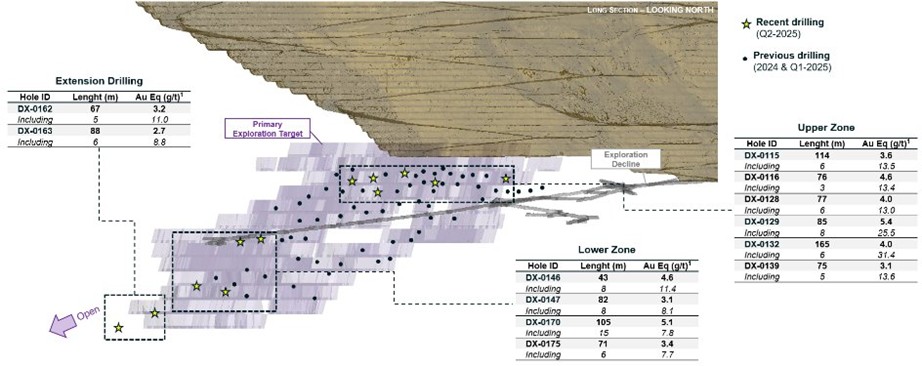
Decline development at Round Mountain Phase X is advancing well, with over 4,500 metres developed to date. Extensive infill drilling has been completed in both the upper zone and lower zones, with results continuing to intersect strong widths and grades, and extension drilling indicating continuation of mineralization down dip outside the original exploration target. Highlights include:
- Upper Zone:
- DX-0115 – 114m @ 3.6 g/t
- Including 6m @ 13.5 g/t
- DX-0116 – 76m @ 4.6g/t
- Including 3m @ 13.4 g/t
- DX-0128 – 77m @ 4.0 g/t
- Including 6m @ 13.0 g/t
- DX-0129 – 85m @ 5.4 g/t
- Including 8m @ 25.5 g/t
- DX-0132 – 165m @ 4.0 g/t
- Including 6m @ 31.4 g/t
- DX-0139 – 75m @ 3.1 g/t
- Including 5m @ 13.6 g/t
- DX-0115 – 114m @ 3.6 g/t
- Lower Zone:
- DX-0146 – 43m @ 4.6 g/t
- Including 8m @ 11.4 g/t
- DX-0147 – 82m @ 3.1 g/t
- Including 8m @ 8.1 g/t
- DX-0170 – 105m @ 5.1 g/t
- Including 15m @ 7.8 g/t
- DX-0175 – 71m @ 3.4 g/t
- Including 6m @ 7.7 g/t
- DX-0146 – 43m @ 4.6 g/t
- Extension Drilling:
- DX-0162 – 67m @ 3.2 g/t
- Including 5m @ 11.0 g/t
- DX-0163 – 88m @ 2.7 g/t
- Including 6m @ 8.8 g/t
- Including 6m @ 8.8 g/t
- DX-0162 – 67m @ 3.2 g/t
Engineering work and technical studies are advancing well to support potential project execution at Phase X.
Kinross plans to provide a project, resource and economics update with year-end results.
See Appendix A for a Round Mountain Phase X long section.
Curlew Basin exploration
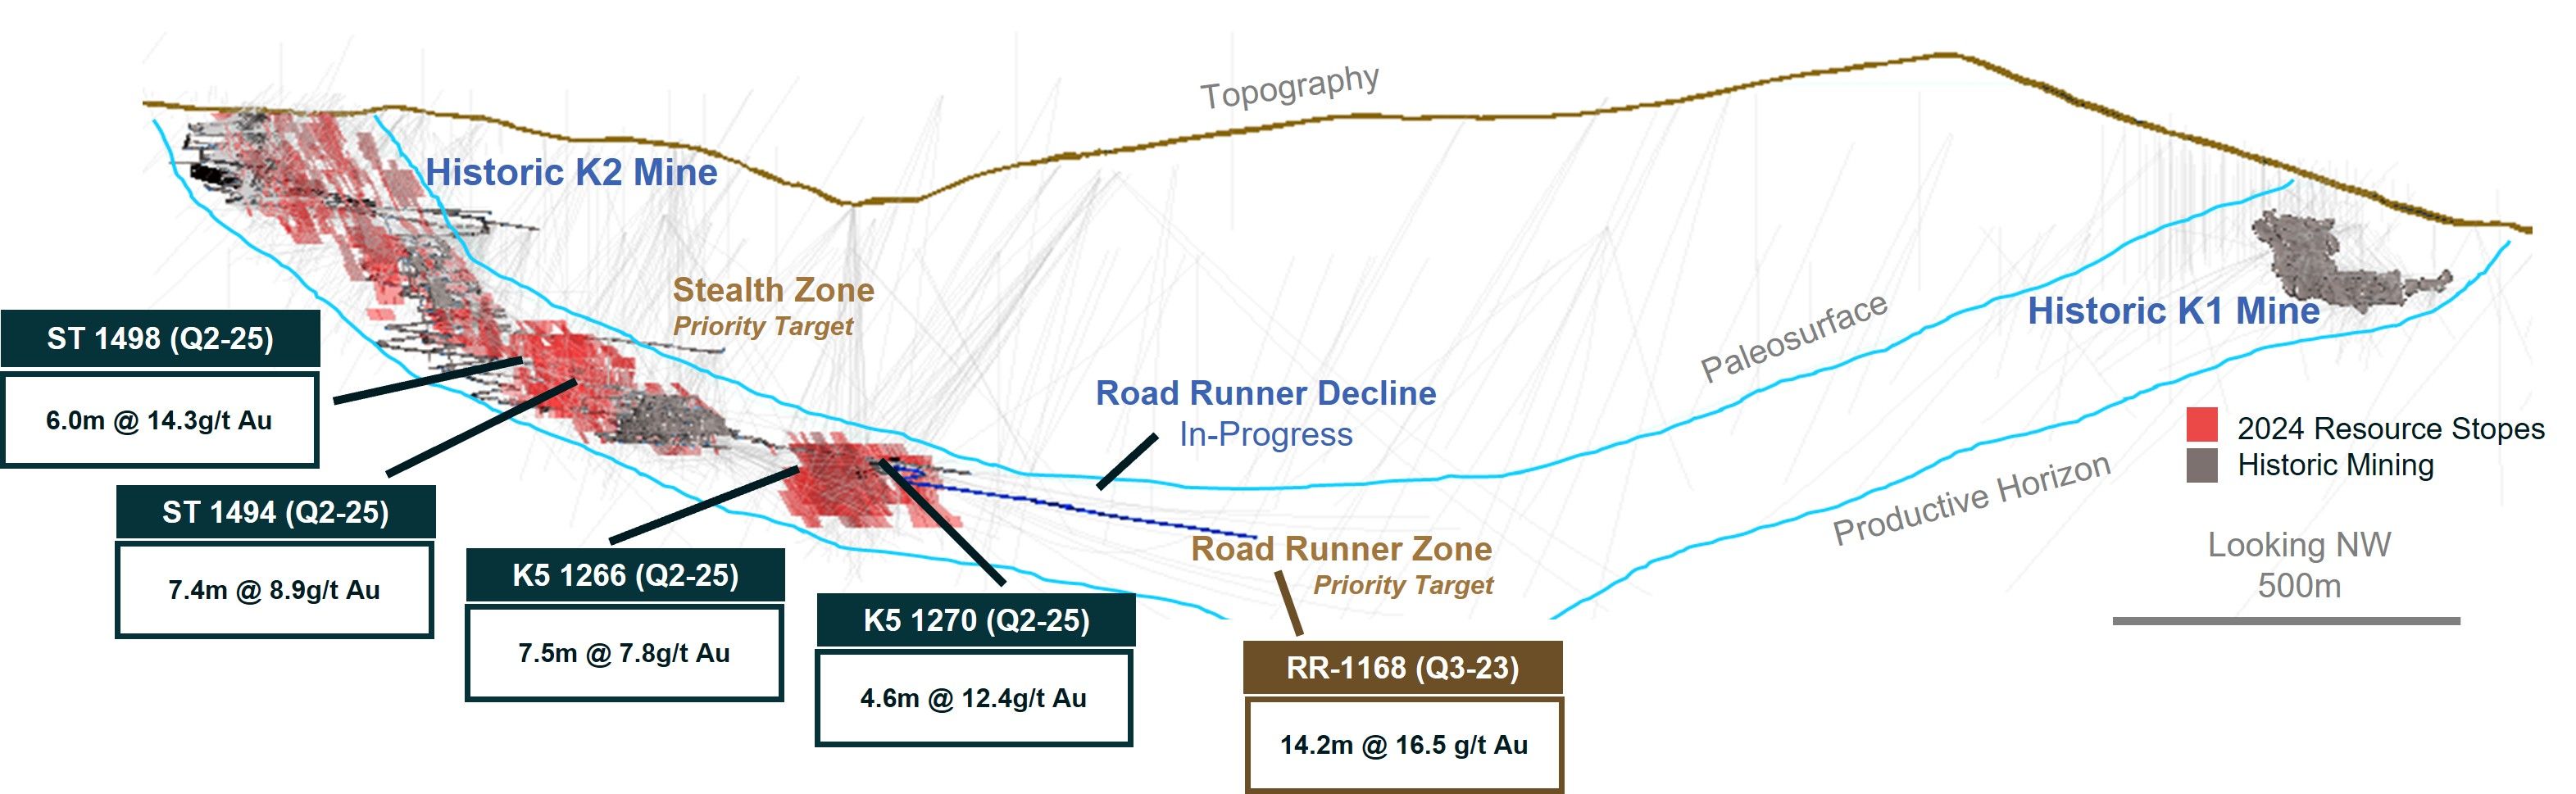
Drilling at Curlew continues to intersect high grades and strong widths at both North Stealth and K5, indicating potential to further improve the quality of the resource and the mine plan with additions of high margin mineralization. Highlights include (true width):
- ST-1498 – 6.0m @ 14.3 g/t Au
- ST-1494 – 7.4m @ 8.9 g/t Au
- K5-1266 – 7.5m @ 7.8 g/t Au
- K5-1270 – 4.6m @ 12.4 g/t Au
Extension of the underground declines is progressing well with over 800 metres developed year-to-date, focused on providing drilling access to follow up on the high grade 2023 discovery at Roadrunner and to extend mineralization in the high grade North Stealth area.
Technical studies and detailed engineering are also progressing well at Curlew.
See Appendix A for a Curlew cross section.
Bald Mountain Redbird
At Redbird, mining is advancing on schedule. Studies and detailed engineering related to the potential Phase 2 extension of Redbird are progressing well, including engineering related to the heap leach pad expansion, technical studies and mine plan optimization work. Exploration drilling and technical studies are also progressing, targeting satellite pit opportunities on the large Bald Mountain property, which could potentially augment the production profile from Redbird 2.
Lobo-Marte
Kinross is progressing baseline studies to support the Environmental Impact Assessment (EIA) for the Lobo-Marte project. Lobo-Marte continues to be a potential large, low-cost mine and Kinross is committed to progressing next steps to advance the project.
Sustainability
Following the publication of Kinross’ 2024 Sustainability Report and summary, below are several water-related highlights, a material sustainability topic for the Company and its stakeholders. Kinross’ water management standard prioritizes water supply security, water conservation and stewardship, and prevention of downstream environmental impacts. There is a strong focus on water efficiency, with a high water recycling rate of 75%, as well as maintaining water quality at locations both near and far from sites. Kinross also maintained its conformance with the Responsible Gold Mining Principles, which include principles for water efficiency and quality.
In Chile, La Coipa contributed to this efficiency through an optimization program of the main processing circuits which resulted in lower water loss going to the dry stack tailings. Near Maricunga, wetland restoration resulted in the resurgence of ecosystem services and the return of native plant species.
At all of the Company’s development projects, science-based methods are utilized to ensure strong baseline information, including environmental DNA studies for the Great Bear project and watershed groundwater modeling for the Lobo-Marte project.
At Fort Knox in Alaska, fish populations continue to thrive at Fish Creek based on continuous monitoring by the Alaska department of Fish and Game since the late 1990s. Fish Creek was a historic placer mining area, reclaimed by Kinross in the early 1990s for the benefit of the local communities. Also in Alaska, Kinross continued its long-standing partnership with Trout Unlimited and the Alaska Abandoned Mine Restoration Initiative, with sustained progress in the recovery of fish populations in Resurrection Creek, south of Anchorage, also a placer mining area.
Conference call details
In connection with this news release, Kinross will hold a conference call and audio webcast on Thursday, July 31, 2025, at 8:00 a.m. EDT to discuss the results, followed by a question-and-answer session. To access the call, please dial:
Canada & US toll-free – 1 (888) 596-4144; Passcode: 9425112
Outside of Canada & US – 1 (646) 968-2525; Passcode: 9425112
Replay (available up to 14 days after the call):
Canada & US toll-free – 1 (800) 770-2030; Passcode: 9425112
Outside of Canada & US – 1 (609) 800-9909; Passcode: 9425112
You may also access the conference call on a listen-only basis via webcast at our website www.kinross.com. The audio webcast will be archived on www.kinross.com.
About Kinross Gold Corporation
Kinross is a Canadian-based global senior gold mining company with operations and projects in the United States, Brazil, Mauritania, Chile and Canada. Our focus is on delivering value based on the core principles of responsible mining, operational excellence, disciplined growth, and balance sheet strength. Kinross maintains listings on the Toronto Stock Exchange (symbol: K) and the New York Stock Exchange (symbol: KGC).
Media Contact
Samantha Sheffield
Director, Corporate Communications
phone: 416-365-3034
Samantha.Sheffield@Kinross.com
Investor Relations Contact
David Shaver
Senior Vice-President, Investor Relations & Communications
phone: 416-365-2854
InvestorRelations@Kinross.com
Review of operations
| Three months ended June 30, | Gold equivalent ounces | |||||||||||||||
| Produced | Sold | Production cost of sales ($millions) | Production cost of sales/equivalent ounce sold | |||||||||||||
| 2025 | 2024 | 2025 | 2024 | 2025 | 2024 | 2025 | 2024 | |||||||||
| Tasiast | 119,241 | 161,629 | 121,745 | 156,038 | 102.6 | 102.3 | 843 | 656 | ||||||||
| Paracatu | 149,264 | 130,228 | 148,787 | 130,174 | 142.6 | 135.2 | 958 | 1,039 | ||||||||
| La Coipa | 54,139 | 65,851 | 50,400 | 63,506 | 70.4 | 58.8 | 1,397 | 926 | ||||||||
| Fort Knox | 115,064 | 69,914 | 113,200 | 70,477 | 141.3 | 94.8 | 1,248 | 1,345 | ||||||||
| Round Mountain | 38,665 | 61,787 | 37,864 | 60,049 | 52.1 | 93.9 | 1,376 | 1,564 | ||||||||
| Bald Mountain | 53,704 | 45,929 | 54,227 | 39,818 | 59.4 | 50.6 | 1,095 | 1,271 | ||||||||
| United States Total | 207,433 | 177,630 | 205,291 | 170,344 | 252.8 | 239.3 | 1,231 | 1,405 | ||||||||
| Less: Manh Choh non-controlling interest (30%) | (17,503) | - | (17,923) | - | (22.5) | - | ||||||||||
| United States Attributable Total | 189,930 | 177,630 | 187,368 | 170,344 | 230.3 | 239.3 | 1,229 | 1,405 | ||||||||
| Operations Total(a) | 530,077 | 535,338 | 526,223 | 520,760 | 568.4 | 536.1 | 1,080 | 1,029 | ||||||||
| Attributable Total(a) | 512,574 | 535,338 | 508,300 | 520,760 | 545.9 | 536.1 | 1,074 | 1,029 | ||||||||
| Six months ended June 30, | Gold equivalent ounces | |||||||||||||||
| Produced | Sold | Production cost of sales ($millions) | Production cost of sales/equivalent ounce sold | |||||||||||||
| 2025 | 2024 | 2025 | 2024 | 2025 | 2024 | 2025 | 2024 | |||||||||
| Tasiast | 256,870 | 320,828 | 251,238 | 307,052 | 207.6 | 202.0 | 826 | 658 | ||||||||
| Paracatu | 295,903 | 258,501 | 295,642 | 258,284 | 282.2 | 270.9 | 955 | 1,049 | ||||||||
| La Coipa | 106,454 | 137,096 | 106,270 | 134,631 | 134.5 | 110.9 | 1,266 | 824 | ||||||||
| Fort Knox | 227,118 | 123,264 | 225,310 | 126,769 | 273.1 | 177.3 | 1,212 | 1,399 | ||||||||
| Round Mountain | 74,351 | 130,139 | 73,824 | 128,218 | 109.1 | 184.5 | 1,478 | 1,439 | ||||||||
| Bald Mountain | 99,242 | 92,909 | 98,028 | 87,059 | 108.6 | 102.7 | 1,108 | 1,180 | ||||||||
| United States Total | 400,711 | 346,312 | 397,162 | 342,046 | 490.8 | 464.5 | 1,236 | 1,358 | ||||||||
| Less: Manh Choh non-controlling interest (30%) | (35,276) | - | (35,448) | - | (43.2) | - | ||||||||||
| United States Attributable Total | 365,435 | 346,312 | 361,714 | 342,046 | 447.6 | 464.5 | 1,237 | 1,358 | ||||||||
| Operations Total(a) | 1,059,938 | 1,062,737 | 1,050,312 | 1,043,160 | 1,115.1 | 1,049.0 | 1,062 | 1,006 | ||||||||
| Attributable Total(a) | 1,024,662 | 1,062,737 | 1,014,864 | 1,043,160 | 1,071.9 | 1,049.0 | 1,056 | 1,006 | ||||||||
| (a) | Totals include immaterial sales and related costs from Maricunga for the three and six months ended June 30, 2024. | |
Consolidated balance sheets
| (unaudited, expressed in millions of U.S. dollars, except share amounts) | ||||||
| As at | ||||||
| June 30, | December 31, | |||||
| 2025 | 2024 | |||||
| Assets | ||||||
| Current assets | ||||||
| Cash and cash equivalents | $ | 1,136.5 | $ | 611.5 | ||
| Restricted cash | 12.7 | 10.2 | ||||
| Accounts receivable and prepaid assets | 239.9 | 257.3 | ||||
| Inventories | 1,344.7 | 1,243.2 | ||||
| Other current assets | 14.8 | 4.5 | ||||
| 2,748.6 | 2,126.7 | |||||
| Non-current assets | ||||||
| Property, plant and equipment | 7,972.7 | 7,968.6 | ||||
| Long-term investments | 89.6 | 51.9 | ||||
| Other long-term assets | 647.2 | 713.1 | ||||
| Deferred tax assets | 5.3 | 5.3 | ||||
| Total assets | $ | 11,463.4 | $ | 10,865.6 | ||
| Liabilities | ||||||
| Current liabilities | ||||||
| Accounts payable and accrued liabilities | $ | 611.3 | $ | 543.0 | ||
| Current income tax payable | 285.9 | 236.7 | ||||
| Current portion of long-term debt | - | 199.9 | ||||
| Current portion of provisions | 60.0 | 62.5 | ||||
| Other current liabilities | 9.5 | 18.0 | ||||
| 966.7 | 1,060.1 | |||||
| Non-current liabilities | ||||||
| Long-term debt | 1,236.4 | 1,235.5 | ||||
| Provisions | 964.3 | 941.5 | ||||
| Other long-term liabilities | 56.3 | 78.9 | ||||
| Deferred tax liabilities | 551.7 | 549.0 | ||||
| Total liabilities | $ | 3,775.4 | $ | 3,865.0 | ||
| Equity | ||||||
| Common shareholders' equity | ||||||
| Common share capital | $ | 4,451.0 | $ | 4,487.3 | ||
| Contributed surplus | 10,503.7 | 10,643.0 | ||||
| Accumulated deficit | (7,356.2) | (8,181.3) | ||||
| Accumulated other comprehensive loss | (44.8) | (87.4) | ||||
| Total common shareholders' equity | 7,553.7 | 6,861.6 | ||||
| Non-controlling interests | 134.3 | 139.0 | ||||
| Total equity | $ | 7,688.0 | $ | 7,000.6 | ||
| Total liabilities and equity | $ | 11,463.4 | $ | 10,865.6 | ||
| Common shares | ||||||
| Authorized | Unlimited | Unlimited | ||||
| Issued and outstanding | 1,218,782,161 | 1,229,125,606 | ||||
Consolidated statements of operations
| (unaudited, expressed in millions of U.S. dollars, except per share amounts) | ||||||||||||
| Three months ended | Six months ended | |||||||||||
| June 30, | June 30, | June 30, | June 30, | |||||||||
| 2025 | 2024 | 2025 | 2024 | |||||||||
| Revenue | ||||||||||||
| Metal sales | $ | 1,728.5 | $ | 1,219.5 | $ | 3,226.0 | $ | 2,301.0 | ||||
| Cost of sales | ||||||||||||
| Production cost of sales | 568.4 | 536.1 | 1,115.1 | 1,049.0 | ||||||||
| Depreciation, depletion and amortization | 262.9 | 295.8 | 551.3 | 566.5 | ||||||||
| Total cost of sales | 831.3 | 831.9 | 1,666.4 | 1,615.5 | ||||||||
| Gross profit | 897.2 | 387.6 | 1,559.6 | 685.5 | ||||||||
| Other operating expense | 31.1 | 1.9 | 45.1 | 29.5 | ||||||||
| Exploration and business development | 61.7 | 55.7 | 104.0 | 97.4 | ||||||||
| General and administrative | 29.6 | 31.7 | 65.3 | 67.1 | ||||||||
| Operating earnings | 774.8 | 298.3 | 1,345.2 | 491.5 | ||||||||
| Other (expense) income - net | (19.8) | 5.7 | (33.0) | 5.8 | ||||||||
| Finance income | 7.4 | 4.5 | 11.6 | 8.4 | ||||||||
| Finance expense | (32.9) | (21.8) | (68.1) | (43.3) | ||||||||
| Earnings before tax | 729.5 | 286.7 | 1,255.7 | 462.4 | ||||||||
| Income tax expense - net | (170.9) | (77.8) | (307.7) | (146.9) | ||||||||
| Net earnings | $ | 558.6 | $ | 208.90 | $ | 948.0 | $ | 315.5 | ||||
| Net earnings (loss) attributable to: | ||||||||||||
| Non-controlling interests | $ | 27.9 | $ | (2.0) | $ | 49.3 | $ | (2.4) | ||||
| Common shareholders | $ | 530.7 | $ | 210.9 | $ | 898.7 | $ | 317.9 | ||||
| Earnings per share attributable to common shareholders | ||||||||||||
| Basic | $ | 0.43 | $ | 0.17 | $ | 0.73 | $ | 0.26 | ||||
| Diluted | $ | 0.43 | $ | 0.17 | $ | 0.73 | $ | 0.26 | ||||
Consolidated statements of cash flows
| (unaudited, expressed in millions of U.S. dollars) | ||||||||||||
| Three months ended | Six months ended | |||||||||||
| June 30, | June 30, | June 30, | June 30, | |||||||||
| 2025 | 2024 | 2025 | 2024 | |||||||||
| Net inflow (outflow) of cash related to the following activities: | ||||||||||||
| Operating: | ||||||||||||
| Net earnings | $ | 558.6 | $ | 208.90 | $ | 948.0 | $ | 315.50 | ||||
| Adjustments to reconcile net earnings to net cash provided from operating activities: | ||||||||||||
| Depreciation, depletion and amortization | 262.9 | 295.8 | 551.3 | 566.5 | ||||||||
| Share-based compensation expense | 3.2 | 2.8 | 7.8 | 5.3 | ||||||||
| Finance expense | 32.9 | 21.8 | 68.1 | 43.3 | ||||||||
| Deferred tax (recovery) expense | (1.0) | (21.2) | 2.5 | (12.6) | ||||||||
| Foreign exchange losses (gains) and other | 23.3 | (7.1) | 8.3 | 7.9 | ||||||||
| Changes in operating assets and liabilities: | ||||||||||||
| Accounts receivable and other assets | 7.2 | 6.2 | 14.3 | 15.0 | ||||||||
| Inventories | 8.9 | 2.5 | (29.5) | 8.4 | ||||||||
| Accounts payable, accrued liabilities and other | 206.4 | 147.0 | 307.0 | 160.6 | ||||||||
| Cash flow provided from operating activities | 1,102.4 | 656.7 | 1,877.8 | 1,109.9 | ||||||||
| Income taxes paid | (110.0) | (52.7) | (288.3) | (131.5) | ||||||||
| Net cash flow provided from operating activities | 992.4 | 604.0 | 1,589.5 | 978.4 | ||||||||
| Investing: | ||||||||||||
| Additions to property, plant and equipment | (306.1) | (274.2) | (513.8) | (516.1) | ||||||||
| Interest paid capitalized to property, plant and equipment | - | (17.0) | (13.5) | (51.9) | ||||||||
| Net additions to long-term investments and other assets | (14.8) | (15.7) | (23.9) | (18.8) | ||||||||
| (Increase) decrease in restricted cash - net | (0.8) | 0.8 | (2.5) | 0.3 | ||||||||
| Interest received and other - net | 9.0 | 3.8 | 13.2 | 7.7 | ||||||||
| Net cash flow used in investing activities | (312.7) | (302.3) | (540.5) | (578.8) | ||||||||
| Financing: | ||||||||||||
| Repayment of debt | - | (200.0) | (200.0) | (200.0) | ||||||||
| Interest paid | - | - | (24.0) | (18.5) | ||||||||
| Payment of lease liabilities | (1.5) | (3.4) | (3.0) | (6.8) | ||||||||
| Funding from non-controlling interest | - | 11.7 | - | 27.2 | ||||||||
| Distributions paid to non-controlling interest | (30.0) | - | (54.0) | - | ||||||||
| Dividends paid to common shareholders | (36.7) | (36.8) | (73.6) | (73.7) | ||||||||
| Repurchase and cancellation of shares | (170.1) | - | (170.1) | - | ||||||||
| Other - net | - | - | - | 0.3 | ||||||||
| Net cash flow used in financing activities | (238.3) | (228.5) | (524.7) | (271.5) | ||||||||
| Effect of exchange rate changes on cash and cash equivalents | 0.5 | (0.1) | 0.7 | (0.5) | ||||||||
| Increase in cash and cash equivalents | 441.9 | 73.1 | 525.0 | 127.6 | ||||||||
| Cash and cash equivalents, beginning of period | 694.6 | 406.9 | 611.5 | 352.4 | ||||||||
| Cash and cash equivalents, end of period | 1,136.5 | 480.0 | $ | 1,136.5 | $ | 480.0 | ||||||
| Operating Summary | ||||||||||||||||||
| Mine | Period | Tonnes Ore Mined | Ore Processed (Milled) | Ore Processed (Heap Leach) | Grade (Mill) | Grade (Heap Leach) | Recovery (a)(b) | Gold Eq Production(c) | Gold Eq Sales(c) | Production cost of sales | Production cost of sales/oz(d) | Cap Ex - sustaining(e) | Total Cap Ex (e) | |||||
| ('000 tonnes) | ('000 tonnes) | ('000 tonnes) | (g/t) | (g/t) | (%) | (ounces) | (ounces) | ($ millions) | ($/ounce) | ($ millions) | ($ millions) | |||||||
| West Africa | Tasiast | Q2 2025 | 1,921 | 1,730 | - | 2.11 | - | 95% | 119,241 | 121,745 | $ | 102.6 | $ | 843 | $ | 23.1 | $ | 89.7 |
| Q1 2025 | 1,812 | 1,932 | - | 2.15 | - | 95% | 137,629 | 129,493 | $ | 105.0 | $ | 811 | $ | 13.7 | $ | 80.1 | ||
| Q4 2024 | 1,824 | 2,205 | - | 2.13 | - | 94% | 139,411 | 144,041 | $ | 104.4 | $ | 725 | $ | 33.7 | $ | 105.4 | ||
| Q3 2024 | 1,748 | 2,203 | - | 2.46 | - | 91% | 162,155 | 158,521 | $ | 109.0 | $ | 688 | $ | 13.5 | $ | 83.8 | ||
| Q2 2024 | 1,985 | 2,161 | - | 2.70 | - | 92% | 161,629 | 156,038 | $ | 102.3 | $ | 656 | $ | 7.0 | $ | 75.2 | ||
| Americas | Paracatu | Q2 2025 | 13,497 | 14,527 | - | 0.39 | - | 82% | 149,264 | 148,787 | $ | 142.6 | $ | 958 | $ | 38.4 | $ | 38.4 |
| Q1 2025 | 13,318 | 12,507 | - | 0.43 | - | 83% | 146,639 | 146,855 | $ | 139.6 | $ | 951 | $ | 24.4 | $ | 24.4 | ||
| Q4 2024 | 12,944 | 13,116 | - | 0.40 | - | 80% | 123,899 | 124,690 | $ | 131.6 | $ | 1,055 | $ | 35.1 | $ | 35.1 | ||
| Q3 2024 | 13,127 | 14,551 | - | 0.38 | - | 81% | 146,174 | 145,235 | $ | 146.1 | $ | 1,006 | $ | 41.2 | $ | 41.2 | ||
| Q2 2024 | 14,094 | 15,053 | - | 0.35 | - | 80% | 130,228 | 130,174 | $ | 135.2 | $ | 1,039 | $ | 44.6 | $ | 44.6 | ||
| La Coipa(f) | Q2 2025 | 580 | 911 | - | 1.77 | - | 78% | 54,139 | 50,400 | $ | 70.4 | $ | 1,397 | $ | 25.0 | $ | 25.0 | |
| Q1 2025 | 1,265 | 971 | - | 2.19 | - | 80% | 52,315 | 55,870 | $ | 64.1 | $ | 1,147 | $ | 15.6 | $ | 15.6 | ||
| Q4 2024 | 1,385 | 1,017 | - | 1.98 | - | 79% | 58,533 | 57,852 | $ | 68.2 | $ | 1,179 | $ | 26.6 | $ | 26.6 | ||
| Q3 2024 | 786 | 809 | - | 2.17 | - | 80% | 50,502 | 48,594 | $ | 52.2 | $ | 1,074 | $ | 21.3 | $ | 24.9 | ||
| Q2 2024 | 690 | 882 | - | 1.97 | - | 84% | 65,851 | 63,506 | $ | 58.8 | $ | 926 | $ | 10.7 | $ | 10.7 | ||
| Fort Knox (100%)(g) | Q2 2025 | 7,639 | 1,636 | 5,529 | 1.72 | 0.23 | 88% | 115,064 | 113,200 | $ | 141.3 | $ | 1,248 | $ | 43.0 | $ | 43.0 | |
| Q1 2025 | 6,530 | 1,071 | 4,790 | 2.77 | 0.19 | 91% | 112,054 | 112,110 | $ | 131.8 | $ | 1,176 | $ | 28.2 | $ | 28.2 | ||
| Q4 2024 | 7,692 | 1,524 | 6,664 | 1.51 | 0.21 | 82% | 104,901 | 108,512 | $ | 141.0 | $ | 1,299 | $ | 53.3 | $ | 54.0 | ||
| Q3 2024 | 7,612 | 1,105 | 5,822 | 4.03 | 0.19 | 91% | 149,093 | 140,121 | $ | 134.2 | $ | 958 | $ | 56.6 | $ | 70.4 | ||
| Q2 2024 | 8,331 | 2,003 | 6,385 | 0.85 | 0.22 | 81% | 69,914 | 70,477 | $ | 94.8 | $ | 1,345.12 | $ | 47.6 | $ | 89.2 | ||
| Fort Knox (attributable)(g) | Q2 2025 | 7,535 | 1,567 | 5,529 | 1.47 | 0.23 | 87% | 97,561 | 95,277 | $ | 118.8 | $ | 1,246.89 | $ | 38.7 | $ | 38.7 | |
| Q1 2025 | 6,445 | 982 | 4,790 | 2.35 | 0.19 | 90% | 94,281 | 94,585 | $ | 111.1 | $ | 1,174.60 | $ | 24.6 | $ | 24.60 | ||
| Q4 2024 | 7,619 | 1,483 | 6,664 | 1.28 | 0.21 | 81% | 91,755 | 94,763 | $ | 125.1 | $ | 1,320.14 | $ | 51.1 | $ | 52.1 | ||
| Q3 2024 | 7,509 | 991 | 5,822 | 3.44 | 0.19 | 91% | 119,500 | 112,346 | $ | 109.3 | $ | 972.89 | $ | 55.4 | $ | 67.2 | ||
| Q2 2024 | 8,249 | 2,003 | 6,385 | 0.85 | 0.22 | 81% | 69,914 | 70,477 | $ | 94.8 | $ | 1,345.12 | $ | 47.6 | $ | 79.5 | ||
| Round Mountain | Q2 2025 | 2,881 | 856 | 1,682 | 0.72 | 0.30 | 80% | 38,665 | 37,864 | $ | 52.1 | $ | 1,376 | $ | 5.70 | $ | 32.8 | |
| Q1 2025 | 1,927 | 856 | 2,163 | 0.66 | 0.27 | 77% | 35,686 | 35,960 | $ | 57.0 | $ | 1,585 | $ | 2.8 | $ | 29.6 | ||
| Q4 2024 | 3,111 | 768 | 1,736 | 1.05 | 0.22 | 82% | 42,969 | 45,342 | $ | 80.0 | $ | 1,764 | $ | 4.4 | $ | 33.9 | ||
| Q3 2024 | 2,958 | 790 | 1,032 | 0.74 | 0.29 | 80% | 42,279 | 41,436 | $ | 63.8 | $ | 1,540 | $ | 5.2 | $ | 35.9 | ||
| Q2 2024 | 2,956 | 806 | 1,541 | 1.11 | 0.35 | 73% | 61,787 | 60,049 | $ | 93.9 | $ | 1,564 | $ | 2.1 | $ | 37.2 | ||
| Bald Mountain | Q2 2025 | 1,578 | - | 1,578 | - | 1.07 | nm | 53,704 | 54,227 | $ | 59.4 | $ | 1,095 | $ | 12.7 | $ | 40.4 | |
| Q1 2025 | 5,803 | - | 5,803 | - | 0.35 | nm | 45,538 | 43,801 | $ | 49.2 | $ | 1,123 | $ | 6.9 | $ | 17.8 | ||
| Q4 2024 | 7,622 | - | 7,622 | - | 0.46 | nm | 44,642 | 51,291 | $ | 58.7 | $ | 1,144 | $ | 4.6 | $ | 6.4 | ||
| Q3 2024 | 6,384 | - | 6,384 | - | 0.53 | nm | 43,496 | 44,410 | $ | 58.9 | $ | 1,326 | $ | 5 | $ | 6.1 | ||
| Q2 2024 | 2,906 | - | 2,906 | - | 0.47 | nm | 45,929 | 39,818 | $ | 50.6 | $ | 1,271 | $ | 4.4 | $ | 4.6 | ||
| (a) | Due to the nature of heap leach operations, recovery rates at Bald Mountain cannot be accurately measured on a quarterly basis. Recovery rates at Fort Knox and Round Mountain represent mill recovery only. | |||||||||||||||||
| (b) | "nm" means not meaningful. | |||||||||||||||||
| (c) | Gold equivalent ounces include silver ounces produced and sold converted to a gold equivalent based on the ratio of the average spot market prices for the commodities for each period. The ratios for the quarters presented are as follows: Q2 2025: 97.41:1; Q1 2025: 89.69:1; Q4 2024: 84.67:1; Q3 2024: 84.06:1; Q2 2024: 81.06:1. | |||||||||||||||||
| (d) | “Production cost of sales per equivalent ounce sold” is defined as production cost of sales divided by total gold equivalent ounces sold. | |||||||||||||||||
| (e) | "Total Cap Ex" is as reported as “Additions to property, plant and equipment” on the interim condensed consolidated statements of cash flows. "Cap Ex - sustaining" is a non-GAAP financial measure. The definition and reconciliation of this non-GAAP financial measure is included on pages 20 to 21 of this news release. | |||||||||||||||||
| (f) | La Coipa silver grade and recovery were as follows: Q2 2025: 28.89 g/t, 50%; Q1 2025: 31.97 g/t, 60%; Q4 2024: 42.57 g/t, 43%; Q3 2024: 49.13 g/t, 58%; Q2 2024: 65.02 g/t, 51%. | |||||||||||||||||
| (g) | The Fort Knox segment is composed of Fort Knox and Manh Choh, and comparative results shown are presented in accordance with the current year’s presentation. Manh Choh tonnes of ore processed and grade were as follows: Q2 2025: 231,451 tonnes, 7.39 g/t; Q1 2025: 294,238 tonnes, 7.39 g/t; Q4 2024: 138,937 tonnes, 9.58 g/t; Q3 2024: 379,786 tonnes, 9.13 g/t. Tonnes of ore processed and grade were nil for all other periods presented as production commenced in July 2024. The attributable results for Fort Knox include 100% of Fort Knox and 70% of Manh Choh. | |||||||||||||||||
Reconciliation of non-GAAP financial measures and ratios
The Company has included certain non-GAAP financial measures and ratios in this document. These financial measures and ratios are not defined under IFRS and should not be considered in isolation. The Company believes that these financial measures and ratios, together with financial measures and ratios determined in accordance with IFRS, provide investors with an improved ability to evaluate the underlying performance of the Company. The inclusion of these financial measures and ratios is meant to provide additional information and should not be used as a substitute for performance measures prepared in accordance with IFRS. These financial measures and ratios are not necessarily standard and therefore may not be comparable to other issuers.
Adjusted Net Earnings and Adjusted Net Earnings per Share
Adjusted net earnings and adjusted net earnings per share are non-GAAP financial measures and ratios which determine the performance of the Company, excluding certain impacts which the Company believes are not reflective of the Company’s underlying performance for the reporting period, such as the impact of foreign exchange gains and losses, reassessment of prior year taxes and/or taxes otherwise not related to the current period, impairment charges (reversals), gains and losses and other one-time costs related to acquisitions, dispositions and other transactions, and non-hedge derivative gains and losses. Although some of the items are recurring, the Company believes that they are not reflective of the underlying operating performance of its current business and are not necessarily indicative of future operating results. Management believes that these measures and ratios, which are used internally to assess performance and in planning and forecasting future operating results, provide investors with the ability to better evaluate underlying performance, particularly since the excluded items are typically not included in public guidance. However, adjusted net earnings and adjusted net earnings per share measures and ratios are not necessarily indicative of net earnings and earnings per share measures and ratios as determined under IFRS.
The following table provides a reconciliation of net earnings to adjusted net earnings for the periods presented:
| (expressed in millions of U.S. dollars, except per share amounts) | Three months ended | Six months ended | ||||||||||
| June 30, | June 30, | |||||||||||
| 2025 | 2024 | 2025 | 2024 | |||||||||
| Net earnings attributable to common shareholders - as reported | $ | 530.7 | $ | 210.9 | $ | 898.7 | $ | 317.9 | ||||
| Adjusting items: | ||||||||||||
| Foreign exchange losses (gains) | 11.1 | (6.4) | 18.8 | -9.9 | ||||||||
| Foreign exchange (gains) losses on translation of tax basis and foreign exchange on deferred income taxes within income tax expense | (15.1) | 20.3 | (21.0) | 24.3 | ||||||||
| Taxes in respect of prior periods | 3.3 | (30.7) | (4.6) | (22.7) | ||||||||
| Tasiast mill fire related costs | 13 | 0 | 13 | 0 | ||||||||
| Insurance recoveries | 0 | (22.9) | 0 | (22.9) | ||||||||
| Other(a) | 1.7 | 4.9 | 3.4 | 15.4 | ||||||||
| Tax effects of the above adjustments | (3.7) | (1.4) | (3.3) | (2.5) | ||||||||
| 10.3 | (36.2) | 6.3 | (18.3) | |||||||||
| Adjusted net earnings | $ | 541.0 | $ | 174.7 | $ | 905 | $ | 299.6 | ||||
| Weighted average number of common shares outstanding - Basic | 1225.7 | 1229 | 1228.1 | 1228.6 | ||||||||
| Adjusted net earnings per share | $ | 0.44 | $ | 0.14 | $ | 0.74 | $ | 0.24 | ||||
| Basic earnings per share attributable to common shareholders - as reported | $ | 0.43 | $ | 0.17 | $ | 0.73 | $ | 0.26 | ||||
| (a) | Other includes various impacts, such as settlement provisions, one-time costs and credits at sites, restructuring costs, adjustments related to prior years as well as gains and losses on assets and hedges, which the Company believes are not reflective of the Company’s underlying performance for the reporting period. | |
Attributable Free Cash Flow
Attributable free cash flow is a non-GAAP financial measure and is defined as net cash flow provided from operating activities less attributable capital expenditures and non-controlling interest included in net cash flows provided from operating activities. The Company believes that this measure, which is used internally to evaluate the Company’s underlying cash generation performance and the ability to repay creditors and return cash to shareholders, provides investors with the ability to better evaluate the Company’s underlying performance. However, this measure is not necessarily indicative of operating earnings or net cash flow provided from operating activities as determined under IFRS.
The following table provides a reconciliation of attributable free cash flow for the periods presented:
| (expressed in millions of U.S. dollars) | Three months ended | Six months ended | ||||||||||||||
| June 30, | June 30, | |||||||||||||||
| 2025 | 2024 | 2025 | 2024 | |||||||||||||
| Net cash flow provided from operating activities - as reported | $ | 992.4 | $ | 604 | $ | 1589.5 | $ | 978.4 | ||||||||
| Adjusting items: | ||||||||||||||||
| Attributable(a) capital expenditures | (301.8 | ) | (264.5 | ) | (505.9 | ) | (496.6 | ) | ||||||||
| Non-controlling interest(b) cash flow (from) used in operating activities | (44 | ) | 6.4 | (66.2 | ) | 9.4 | ||||||||||
| Attributable(a) free cash flow | $ | 646.6 | $ | 345.9 | $ | 1017.4 | $ | 491.2 | ||||||||
See pages 21 and 22 for details of the footnotes referenced within the table above.
Attributable Adjusted Operating Cash Flow
Attributable adjusted operating cash flow is a non-GAAP financial measure and is defined as net cash flow provided from operating activities excluding changes in working capital, certain impacts which the Company believes are not reflective of the Company’s regular operating cash flow, and net cash flows provided from operating activities, net of working capital changes, relating to non-controlling interests. Working capital can be volatile due to numerous factors, including the timing of tax payments. The Company uses attributable adjusted operating cash flow internally as a measure of the underlying operating cash flow performance and future operating cash flow-generating capability of the Company. However, the attributable adjusted operating cash flow measure is not necessarily indicative of net cash flow provided from operating activities as determined under IFRS.
The following table provides a reconciliation of attributable adjusted operating cash flow for the periods presented:
| (expressed in millions of U.S. dollars) | Three months ended | Six months ended | |||||||||||||
| June 30, | June 30, | ||||||||||||||
| 2025 | 2024 | 2025 | 2024 | ||||||||||||
| Net cash flow provided from operating activities - as reported | $ | 992.4 | $ | 604 | $ | 1589.5 | $ | 978.4 | |||||||
| Adjusting items: | |||||||||||||||
| Insurance proceeds received in respect of prior years | - | (22.9 | ) | - | (22.9 | ) | |||||||||
| Working capital changes: | |||||||||||||||
| Accounts receivable and other assets | (7.2 | ) | (6.2 | ) | (14.3 | ) | (15 | ) | |||||||
| Inventories | (8.9 | ) | (2.5 | ) | 29.5 | (8.4 | ) | ||||||||
| Accounts payable, accrued liabilities and other, including income taxes paid | (96.4 | ) | (94.3 | ) | (18.7 | ) | (29.1 | ) | |||||||
| 879.9 | 478.1 | 1586 | 903 | ||||||||||||
| Non-controlling interest(b) cash flow (from) used in operating activities, net of working capital changes | (36 | ) | 0.2 | (65.9 | ) | 1 | |||||||||
| Attributable(a) adjusted operating cash flow | $ | 843.9 | $ | 478.3 | $ | 1520.1 | $ | 904 | |||||||
See pages 21 and 22 for details of the footnotes referenced within the table above.
Attributable Average Realized Gold Price per Ounce
Attributable average realized gold price per ounce is a non-GAAP ratio which calculates the average price realized from gold sales attributable to the Company. The Company believes that this measure provides a more accurate measure with which to compare the Company's gold sales performance to market gold prices. The following table provides a reconciliation of attributable average realized gold price per ounce for the periods presented:
| Three months ended | Six months ended | ||||||||||||
| (expressed in millions of U.S. dollars, except ounces and average realized gold price per ounce) | June 30, | June 30, | |||||||||||
| 2025 | 2024 | 2025 | 2024 | ||||||||||
| Metal sales - as reported | $ | 1,728.5 | $ | 1,219.5 | $ | 3,226 | $ | 2,301 | |||||
| Less: silver revenue(c) | (22.6 | ) | (36.7 | ) | (45.1 | ) | (75.8 | ) | |||||
| Less: non-controlling interest(b) gold revenue | (58.0 | ) | - | (108.1 | ) | - | |||||||
| Attributable(a) gold revenue | $ | 1,647.9 | $ | 1,182.8 | $ | 3,072.8 | $ | 2,225.2 | |||||
| Gold ounces sold | 519,391 | 505,122 | 103,5659 | 100,8726 | |||||||||
| Less: non-controlling interest(b) gold ounces sold | (17,764 | ) | - | (35,147 | ) | - | |||||||
| Attributable(a) gold ounces sold | 501,627 | 505,122 | 100,0512 | 100,8726 | |||||||||
| Attributable(a) average realized gold price per ounce | $ | 3,285 | $ | 2,342 | $ | 3,071 | $ | 2,206 | |||||
| Average realized gold price per ounce(d) | $ | 3,284 | $ | 2,342 | $ | 3,071 | $ | 2,206 | |||||
See pages 21 and 22 for details of the footnotes referenced within the table above.
Attributable Production Cost of Sales per Equivalent Ounce Sold
Production cost of sales per equivalent ounce sold is defined as production cost of sales, as reported on the interim condensed consolidated statement of operations, divided by the total number of gold equivalent ounces sold. This measure converts the Company’s non-gold production into gold equivalent ounces and credits it to total production.
Attributable production cost of sales per equivalent ounce sold is a non-GAAP ratio and is defined as attributable production cost of sales divided by the attributable number of gold equivalent ounces sold. This measure converts the Company’s attributable non-gold production into gold equivalent ounces and credits it to total attributable production. Management uses this measure to monitor and evaluate the performance of its operating properties that are attributable to its shareholders.
The following table provides a reconciliation of production cost of sales and attributable production cost of sales per equivalent ounce sold for the periods presented:
| (expressed in millions of U.S. dollars, except ounces and production cost of sales per equivalent ounce) | Three months ended | Six months ended | ||||||||||||
| June 30, | June 30, | |||||||||||||
| 2025 | 2024 | 2025 | 2024 | |||||||||||
| Production cost of sales - as reported | $ | 568.4 | $ | 536.1 | $ | 1,115.1 | $ | 1,049.0 | ||||||
| Less: non-controlling interest(b) production cost of sales | (22.5 | ) | - | (43.2 | ) | - | ||||||||
| Attributable(a) production cost of sales | $ | 545.9 | $ | 536.1 | $ | 1,071.9 | $ | 1,049.0 | ||||||
| Gold equivalent ounces sold | 526,223 | 520,760 | 1,050,312 | 1,043,160 | ||||||||||
| Less: non-controlling interest(b) gold equivalent ounces sold | (17,923 | ) | - | (35,448 | ) | - | ||||||||
| Attributable(a) gold equivalent ounces sold | 508,300 | 520,760 | 1,014,864 | 1,043,160 | ||||||||||
| Attributable(a) production cost of sales per equivalent ounce sold | $ | 1,074 | $ | 1,029 | $ | 1,056 | $ | 1,006 | ||||||
| Production cost of sales per equivalent ounce sold(e) | $ | 1,080 | $ | 1,029 | $ | 1,062 | $ | 1,006 | ||||||
See pages 21 and 22 for details of the footnotes referenced within the table above.
Attributable Production Cost of Sales per Ounce Sold on a By-Product Basis
Attributable production cost of sales per ounce sold on a by-product basis is a non-GAAP ratio which calculates the Company’s non-gold production as a credit against its per ounce production costs, rather than converting its non-gold production into gold equivalent ounces and crediting it to total production, as is the case in co-product accounting. Management believes that this ratio provides investors with the ability to better evaluate Kinross’ production cost of sales per ounce on a comparable basis with other major gold producers who routinely calculate their cost of sales per ounce using by-product accounting rather than co-product accounting.
The following table provides a reconciliation of attributable production cost of sales per ounce sold on a by-product basis for the periods presented:
| (expressed in millions of U.S. dollars, except ounces and production cost of sales per ounce) | Three months ended | Six months ended | ||||||||||||
| June 30, | June 30, | |||||||||||||
| 2025 | 2024 | 2025 | 2024 | |||||||||||
| Production cost of sales - as reported | $ | 568.4 | $ | 536.1 | $ | 1,115.1 | $ | 1,049.0 | ||||||
| Less: non-controlling interest(b) production cost of sales | (22.5 | ) | - | (43.2 | ) | - | ||||||||
| Less: attributable(a) silver revenue(c) | (22.0 | ) | (36.7 | ) | (44.1 | ) | (75.8 | ) | ||||||
| Attributable(a) production cost of sales net of silver by-product revenue | $ | 523.9 | $ | 499.4 | $ | 1,027.8 | $ | 973.2 | ||||||
| Gold ounces sold | 519,391 | 505,122 | 1,035,659 | 1,008,726 | ||||||||||
| Less: non-controlling interest(b) gold ounces sold | (17,764 | ) | - | (35,147 | ) | - | ||||||||
| Attributable(a) gold ounces sold | 501,627 | 505,122 | 1,000,512 | 1,008,726 | ||||||||||
| Attributable(a) production cost of sales per ounce sold on a by-product basis | $ | 1,044 | $ | 989 | $ | 1,027 | $ | 965 | ||||||
| Production cost of sales per equivalent ounce sold(e) | $ | 1,080 | $ | 1,029 | $ | 1,062 | $ | 1,006 | ||||||
See pages 21 and 22 for details of the footnotes referenced within the table above.
Attributable All-In Sustaining Cost and All-In Cost per Ounce Sold on a By-Product Basis
Attributable all-in sustaining cost and all-in cost per ounce sold on a by-product basis are non-GAAP financial measures and ratios, as applicable, calculated based on guidance published by the World Gold Council (“WGC”). The WGC is a market development organization for the gold industry and is an association whose membership comprises leading gold mining companies including Kinross. Although the WGC is not a mining industry regulatory organization, it worked closely with its member companies to develop these metrics. Adoption of the all-in sustaining cost and all-in cost metrics is voluntary and not necessarily standard, and therefore, these measures and ratios presented by the Company may not be comparable to similar measures and ratios presented by other issuers. The Company believes that the all-in sustaining cost and all-in cost measures complement existing measures and ratios reported by Kinross.
All-in sustaining cost includes both operating and capital costs required to sustain gold production on an ongoing basis. The value of silver sold is deducted from the total production cost of sales as it is considered residual production, i.e. a by-product. Sustaining operating costs represent expenditures incurred at current operations that are considered necessary to maintain current production. Sustaining capital represents capital expenditures at existing operations comprising mine development costs, including capitalized development, and ongoing replacement of mine equipment and other capital facilities, and does not include capital expenditures for major growth projects or enhancement capital for significant infrastructure improvements at existing operations.
All-in cost is comprised of all-in sustaining cost as well as operating expenditures incurred at locations with no current operation, or costs related to other non-sustaining activities, and capital expenditures for major growth projects or enhancement capital for significant infrastructure improvements at existing operations.
Attributable all-in sustaining cost and all-in cost per ounce sold on a by-product basis are calculated by adjusting production cost of sales, as reported on the interim condensed consolidated statements of operations, as follows:
| (expressed in millions of U.S. dollars, except ounces and costs per ounce) | Three months ended | Six months ended | ||||||||||||
| June 30, | June 30, | |||||||||||||
| 2025 | 2024 | 2025 | 2024 | |||||||||||
| Production cost of sales - as reported | $ | 568.4 | $ | 536.1 | $ | 1,115.1 | $ | 1,049.0 | ||||||
| Less: non-controlling interest(b) production cost of sales | (22.5 | ) | - | (43.2 | ) | - | ||||||||
| Less: attributable(a) silver revenue(c) | (22.0 | ) | (36.7 | ) | (44.1 | ) | (75.8 | ) | ||||||
| Attributable(a) production cost of sales net of silver by-product revenue | $ | 523.9 | $ | 499.4 | $ | 1,027.8 | $ | 973.2 | ||||||
| Adjusting items on an attributable(a) basis: | ||||||||||||||
| General and administrative(f) | 29.6 | 32.4 | 65.3 | 63.1 | ||||||||||
| Other operating expense - sustaining(g) | 0.9 | 1.6 | 1.1 | 2.4 | ||||||||||
| Reclamation and remediation - sustaining(h) | 22.4 | 19.4 | 44.7 | 37.7 | ||||||||||
| Exploration and business development - sustaining(i) | 15.3 | 13.1 | 27.8 | 21.8 | ||||||||||
| Additions to property, plant and equipment - sustaining(j) | 143.7 | 116.5 | 231.9 | 225.8 | ||||||||||
| Lease payments - sustaining(k) | 1.3 | 3.3 | 2.6 | 6.7 | ||||||||||
| All-in Sustaining Cost on a by-product basis - attributable(a) | $ | 737.1 | $ | 685.7 | $ | 1,401.2 | $ | 1,330.7 | ||||||
| Adjusting items on an attributable(a) basis: | ||||||||||||||
| Other operating expense - non-sustaining(g) | 19.1 | 9.8 | 35.3 | 19.9 | ||||||||||
| Reclamation and remediation - non-sustaining(h) | 2.3 | 1.7 | 4.6 | 3.4 | ||||||||||
| Exploration and business development - non-sustaining(i) | 45.5 | 41.8 | 74.9 | 74.7 | ||||||||||
| Additions to property, plant and equipment - non-sustaining(j) | 158.1 | 148.0 | 274.0 | 270.8 | ||||||||||
| Lease payments - non-sustaining(k) | 0.2 | 0.1 | 0.4 | 0.1 | ||||||||||
| All-in Cost on a by-product basis - attributable(a) | $ | 962.3 | $ | 887.1 | $ | 1,790.4 | $ | 1,699.6 | ||||||
| Gold ounces sold | 519,391 | 505,122 | 1,035,659 | 1,008,726 | ||||||||||
| Less: non-controlling interest(b) gold ounces sold | (17,764 | ) | - | (35,147 | ) | - | ||||||||
| Attributable(a) gold ounces sold | 501,627 | 505,122 | 1,000,512 | 1,008,726 | ||||||||||
| Attributable(a) all-in sustaining cost per ounce sold on a by-product basis | $ | 1,469 | $ | 1,357 | $ | 1,400 | $ | 1,319 | ||||||
| Attributable(a) all-in cost per ounce sold on a by-product basis | $ | 1,918 | $ | 1,756 | $ | 1,789 | $ | 1,685 | ||||||
| Production cost of sales per equivalent ounce sold(e) | $ | 1,080 | $ | 1,029 | $ | 1,062 | $ | 1,006 | ||||||
See pages 21 and 22 for details of the footnotes referenced within the table above.
Attributable All-In Sustaining Cost and All-In Cost per Equivalent Ounce Sold
The Company also assesses its attributable all-in sustaining cost and all-in cost on a gold equivalent ounce basis. Under these non-GAAP financial measures and ratios, the Company’s production of silver is converted into gold equivalent ounces and credited to total production.
Attributable all-in sustaining cost and all-in cost per equivalent ounce sold are calculated by adjusting production cost of sales, as reported on the interim condensed consolidated statements of operations, as follows:
| (expressed in millions of U.S. dollars, except ounces and costs per ounce) | Three months ended | Six months ended | ||||||||||||
| June 30, | June 30, | |||||||||||||
| 2025 | 2024 | 2025 | 2024 | |||||||||||
| Production cost of sales - as reported | $ | 568.4 | $ | 536.1 | $ | 1,115.1 | $ | 1,049.0 | ||||||
| Less: non-controlling interest(b) production cost of sales | (22.5 | ) | - | (43.2 | ) | - | ||||||||
| Attributable(a) production cost of sales | $ | 545.9 | $ | 536.1 | $ | 1,071.9 | $ | 1,049.0 | ||||||
| Adjusting items on an attributable(a) basis: | ||||||||||||||
| General and administrative(f) | 29.6 | 32.4 | 65.3 | 63.1 | ||||||||||
| Other operating expense - sustaining(g) | 0.9 | 1.6 | 1.1 | 2.4 | ||||||||||
| Reclamation and remediation - sustaining(h) | 22.4 | 19.4 | 44.7 | 37.7 | ||||||||||
| Exploration and business development - sustaining(i) | 15.3 | 13.1 | 27.8 | 21.8 | ||||||||||
| Additions to property, plant and equipment - sustaining(j) | 143.7 | 116.5 | 231.9 | 225.8 | ||||||||||
| Lease payments - sustaining(k) | 1.3 | 3.3 | 2.6 | 6.7 | ||||||||||
| All-in Sustaining Cost - attributable(a) | $ | 759.1 | $ | 722.4 | $ | 1,445.3 | $ | 1,406.5 | ||||||
| Adjusting items on an attributable(a) basis: | ||||||||||||||
| Other operating expense - non-sustaining(g) | 19.1 | 9.8 | 35.3 | 19.9 | ||||||||||
| Reclamation and remediation - non-sustaining(h) | 2.3 | 1.7 | 4.6 | 3.4 | ||||||||||
| Exploration and business development - non-sustaining(i) | 45.5 | 41.8 | 74.9 | 74.7 | ||||||||||
| Additions to property, plant and equipment - non-sustaining(j) | 158.1 | 148.0 | 274.0 | 270.8 | ||||||||||
| Lease payments - non-sustaining(k) | 0.2 | 0.1 | 0.4 | 0.1 | ||||||||||
| All-in Cost - attributable(a) | $ | 984.3 | $ | 923.8 | $ | 1,834.5 | $ | 1,775.4 | ||||||
| Gold equivalent ounces sold | 526,223 | 520,760 | 1,050,312 | 1,043,160 | ||||||||||
| Less: non-controlling interest(b) gold equivalent ounces sold | (17,923 | ) | - | (35,448 | ) | - | ||||||||
| Attributable(a) gold equivalent ounces sold | 508,300 | 520,760 | 1,014,864 | 1,043,160 | ||||||||||
| Attributable(a) all-in sustaining cost per equivalent ounce sold | $ | 1,493 | $ | 1,387 | $ | 1,424 | $ | 1,348 | ||||||
| Attributable(a) all-in cost per equivalent ounce sold | $ | 1,936 | $ | 1,774 | $ | 1,808 | $ | 1,702 | ||||||
| Production cost of sales per equivalent ounce sold(e) | $ | 1,080 | $ | 1,029 | $ | 1,062 | $ | 1,006 | ||||||
See pages 21 and 22 for details of the footnotes referenced within the table above.
Capital Expenditures and Attributable Capital Expenditures
Capital expenditures are classified as either sustaining capital expenditures or non-sustaining capital expenditures, depending on the nature of the expenditure. Sustaining capital expenditures typically represent capital expenditures at existing operations including capitalized exploration costs and capitalized development unless related to major projects, ongoing replacement of mine equipment and other capital facilities and other capital expenditures and is calculated as total additions to property, plant and equipment (as reported on the interim condensed consolidated statements of cash flows), less non-sustaining capital expenditures. Non-sustaining capital expenditures represent capital expenditures for major projects, including major capital development projects at existing operations that are expected to materially benefit the operation, as well as enhancement capital for significant infrastructure improvements at existing operations. Management believes the distinction between sustaining capital expenditures and non-sustaining expenditures is a useful indicator of the purpose of capital expenditures and this distinction is an input into the calculation of attributable all-in sustaining costs per ounce and attributable all-in costs per ounce. The categorization of sustaining capital expenditures and non-sustaining capital expenditures is consistent with the definitions under the WGC all-in cost standard. Sustaining capital expenditures and non-sustaining capital expenditures are not defined under IFRS, however, the sum of these two measures total to additions to property, plant and equipment as disclosed under IFRS on the interim condensed consolidated statements of cash flows.
Additions to property, plant and equipment per the interim condensed consolidated statements of cash flows includes 100% of capital expenditures for Manh Choh. Attributable capital expenditures is a non-GAAP financial measure and includes Kinross' 70% share of capital expenditures for Manh Choh. Management believes this to be a useful indicator of Kinross’ cash resources utilized for capital expenditures.
The following table provides a reconciliation of the classification of capital expenditures for the periods presented:
| (expressed in millions of U.S. dollars) | ||||||||||||||||||||||
| Three months ended June 30, 2025 | Tasiast (Mauritania) | Paracatu (Brazil) | La Coipa (Chile) | Fort Knox(l) (USA) | Round Mountain (USA) | Bald Mountain (USA) | Total USA | Other | Total | |||||||||||||
| Sustaining capital expenditures | $ | 23.1 | $ | 38.4 | $ | 25.0 | $ | 43.0 | $ | 5.7 | $ | 12.7 | $ | 61.4 | $ | 0.1 | $ | 148.0 | ||||
| Non-sustaining capital expenditures | 66.6 | - | - | - | 27.1 | $ | 27.7 | $ | 54.8 | 36.7 | 158.1 | |||||||||||
| Additions to property, plant and equipment - per cash flow | $ | 89.7 | $ | 38.4 | $ | 25.0 | $ | 43.0 | $ | 32.8 | $ | 40.4 | $ | 116.2 | $ | 36.8 | $ | 306.1 | ||||
| Less: Non-controlling interest(b) | $ | - | $ | - | $ | - | $ | (4.3 | ) | $ | - | $ | - | $ | (4.3 | ) | $ | - | $ | (4.3 | ) | |
| Attributable(a) capital expenditures | $ | 89.7 | $ | 38.4 | $ | 25.0 | $ | 38.7 | $ | 32.8 | $ | 40.4 | $ | 111.9 | $ | 36.8 | $ | 301.8 | ||||
| Three months ended June 30, 2024 | ||||||||||||||||||||||
| Sustaining capital expenditures | $ | 7.0 | $ | 44.6 | $ | 10.7 | $ | 47.6 | $ | 2.1 | $ | 4.4 | $ | $ 54.1 | $ | 0.1 | $ | 116.5 | ||||
| Non-sustaining capital expenditures | 68.2 | - | - | 41.6 | 35.1 | 0.2 | 76.9 | 12.6 | 157.7 | |||||||||||||
| Additions to property, plant and equipment - per cash flow | $ | 75.2 | $ | 44.6 | $ | 10.7 | $ | 89.2 | $ | 37.2 | $ | 4.6 | $ | 131.0 | $ | 12.7 | $ | 274.2 | ||||
| Less: Non-controlling interest(b) | $ | - | $ | - | $ | - | $ | (9.7 | ) | $ | - | $ | - | $ | (9.7 | ) | $ | - | $ | (9.7 | ) | |
| Attributable(a) capital expenditures | $ | 75.2 | $ | 44.6 | $ | 10.7 | $ | 79.5 | $ | 37.2 | $ | 4.6 | $ | 121.3 | $ | 12.7 | $ | 264.5 | ||||
| (expressed in millions of U.S. dollars) | ||||||||||||||||||||||
| Six months ended June 30, 2025 | Tasiast (Mauritania) | Paracatu (Brazil) | La Coipa (Chile) | Fort Knox(l)(USA) | Round Mountain (USA) | Bald Mountain (USA) | Total USA | Other | Total | |||||||||||||
| Sustaining capital expenditures | $ | 36.8 | $ | 62.8 | $ | 40.6 | $ | 71.2 | $ | 8.5 | $ | 19.6 | $ | 99.3 | $ | 0.3 | $ | 239.8 | ||||
| Non-sustaining capital expenditures | 133.0 | - | - | - | 53.9 | 38.6 | 92.5 | 48.5 | 274.0 | |||||||||||||
| Additions to property, plant and equipment - per cash flow | $ | 169.8 | $ | 62.8 | $ | 40.6 | $ | 71.2 | $ | 62.4 | $ | 58.2 | $ | 191.8 | $ | 48.8 | $ | 513.8 | ||||
| Less: Non-controlling interest(b) | $ | - | $ | - | $ | - | $ | (7.9 | ) | $ | - | $ | - | $ | (7.9 | ) | $ | - | $ | (7.9 | ) | |
| Attributable(a) capital expenditures | $ | 169.8 | $ | 62.8 | $ | 40.6 | $ | 63.3 | $ | 62.4 | $ | 58.2 | $ | 183.9 | $ | 48.8 | $ | 505.9 | ||||
| Six months ended June 30, 2024 | ||||||||||||||||||||||
| Sustaining capital expenditures | $ | 17.1 | $ | 64.2 | $ | 17.9 | $ | 85.3 | $ | 5.8 | $ | 36.8 | $ | 127.9 | $ | (1.3 | ) | $ | 225.8 | |||
| Non-sustaining capital expenditures | 137.6 | - | - | 82.5 | 50.7 | 0.2 | 133.4 | 19.3 | 290.3 | |||||||||||||
| Additions to property, plant and equipment - per cash flow | $ | 154.7 | $ | 64.2 | $ | 17.9 | $ | 167.8 | $ | 56.5 | $ | 37.0 | $ | 261.3 | $ | 18.0 | $ | 516.1 | ||||
| Less: Non-controlling interest(b) | $ | - | $ | - | $ | - | $ | (19.5 | ) | $ | - | $ | - | $ | (19.5 | ) | $ | - | $ | (19.5 | ) | |
| Attributable(a) capital expenditures | $ | 154.7 | $ | 64.2 | $ | 17.9 | $ | 148.3 | $ | 56.5 | $ | 37.0 | $ | 241.8 | $ | 18.0 | $ | 496.6 | ||||
See pages 21 and 22 for details of the footnotes referenced within the tables above.
| (a) | “Attributable” measures and ratios include Kinross’ share of Manh Choh (70%) sales, costs, cash flows and capital expenditures. | |
| (b) | “Non-controlling interest” represents the non-controlling interest portion in Manh Choh (30%) and other subsidiaries for which the Company’s interest is less than 100% for cash flow from operating activities, costs, sales and capital expenditures, as appropriate. | |
| (c) | “Silver revenue” represents the portion of metal sales realized from the production of secondary or by-product metal (i.e. silver), which is produced as a by-product of the process used to produce gold and effectively reduces the cost of gold production. | |
| (d) | “Average realized gold price per ounce” is defined as gold revenue divided by total gold ounces sold. | |
| (e) | “Production cost of sales per equivalent ounce sold” is defined as production cost of sales divided by total gold equivalent ounces sold. | |
| (f) | “General and administrative” expenses are as reported on the interim condensed consolidated statements of operations, excluding certain impacts which the Company believes are not reflective of the Company’s underlying performance for the reporting period. General and administrative expenses are considered sustaining costs as they are required to be absorbed on a continuing basis for the effective operation and governance of the Company. | |
| (g) | “Other operating expense – sustaining” is calculated as “Other operating expense” as reported on the interim condensed consolidated statements of operations, less the non-controlling interest portion in Manh Choh (30%) and other subsidiaries for which the Company’s interest is less than 100% and other operating and reclamation and remediation expenses related to non-sustaining activities as well as other items not reflective of the underlying operating performance of the Company. Other operating expenses are classified as either sustaining or non-sustaining based on the type and location of the expenditure incurred. The majority of other operating expenses that are incurred at existing operations are considered costs necessary to sustain operations, and are therefore, classified as sustaining. Other operating expenses incurred at locations where there is no current operation or related to other non-sustaining activities are classified as non-sustaining. | |
| (h) | “Reclamation and remediation – sustaining” is calculated as current period accretion related to reclamation and remediation obligations plus current period amortization of the corresponding reclamation and remediation assets, less the non-controlling interest portion in Manh Choh (30%) and other subsidiaries for which the Company’s interest is less than 100%, and is intended to reflect the periodic cost of reclamation and remediation for currently operating mines. Reclamation and remediation costs for development projects or closed mines are excluded from this amount and classified as non-sustaining. | |
| (i) | “Exploration and business development – sustaining” is calculated as “Exploration and business development” expenses as reported on the interim condensed consolidated statements of operations, less the non-controlling interest portion in Manh Choh (30%) and other subsidiaries for which the Company’s interest is less than 100% and non-sustaining exploration and business development expenses. Exploration expenses are classified as either sustaining or non-sustaining based on a determination of the type and location of the exploration expenditure. Exploration expenditures within the footprint of operating mines are considered costs required to sustain current operations and are therefore included in sustaining costs. Exploration expenditures focused on new ore bodies near existing mines (i.e. brownfield), new exploration projects (i.e. greenfield) or for other generative exploration activity not linked to existing mining operations are classified as non-sustaining. Business development expenses are classified as either sustaining or non-sustaining based on a determination of the type of expense and requirement for general or growth-related operations. | |
| (j) | “Additions to property, plant and equipment – sustaining” and “non-sustaining” are as presented on pages 20 and 21 of this news release and include Kinross’ share of Manh Choh’s (70%) sustaining and non-sustaining capital expenditures. | |
| (k) | “Lease payments – sustaining” represents the majority of lease payments as reported on the interim condensed consolidated statements of cash flows and is made up of the principal and financing components of such cash payments, less the non-controlling interest portion in Manh Choh (30%) and other subsidiaries for which the Company’s interest is less than 100%, and non-sustaining lease payments. Lease payments for development projects or closed mines are classified as non-sustaining. | |
| (l) | The Fort Knox segment is composed of Fort Knox and Manh Choh for all periods presented. | |
Appendix A
Figure 1: At Round Mountain Phase X, drilling continues to confirm good grades and widths in the primary target zones. Further, extension drilling is showing continuation of down dip mineralization outside of the original target zone.
A photo accompanying this announcement is available at https://www.globenewswire.com/NewsRoom/AttachmentNg/35c67e19-628d-46b4-9d40-f684abc11797
Figure 2: At Curlew, drill results continued to demonstrate wide, high-grade intercepts.
A photo accompanying this announcement is available at https://www.globenewswire.com/NewsRoom/AttachmentNg/41ac9a18-22e2-4b77-ae81-8a398e7b06b9
Cautionary statement on forward-looking information
All statements, other than statements of historical fact, contained or incorporated by reference in this news release including, but not limited to, any information as to the future financial or operating performance of Kinross, constitute “forward-looking information” or “forward-looking statements” within the meaning of certain securities laws, including the provisions of the Securities Act (Ontario) and the provisions for “safe harbor” under the United States Private Securities Litigation Reform Act of 1995 and are based on expectations, estimates and projections as of the date of this news release. Forward-looking statements contained in this news release, include, but are not limited to, those under the headings (or headings that include) “2025 second-quarter highlights”, “Return of Capital to shareholders”, “Operations highlights”, “Development and exploration projects” and “CEO commentary”, as well as statements with respect to our guidance for production, cost guidance, including production costs of sales, all-in sustaining cost of sales, and capital expenditures; anticipated returns of capital to shareholders, including the declaration, payment and sustainability of the Company’s dividends; the size, scope and execution of the proposed share buybacks and the anticipated timing thereof, including the Company’s statement targeting share buybacks for 2025 of at least $500 million; identification of additional resources and reserves or the conversion of resources to reserves; the Company’s liquidity; the Company’s debt levels; the schedules budgets, and forecast economics for the Company’s development projects; budgets for and future plans for exploration, development and operation at the Company’s operations and projects, including the Great Bear project; potential mine life extensions at the Company’s operations; the Company’s balance sheet and liquidity outlook, as well as references to other possible events including, the future price of gold and silver, costs of production, operating costs; price inflation; capital expenditures, costs and timing of the development of projects and new deposits, estimates and the realization of such estimates (such as mineral or gold reserves and resources or mine life), success of exploration, development and mining, currency fluctuations, capital requirements, project studies, government regulation, permit applications, environmental risks and proceedings, and resolution of pending litigation. The words “advance”, “continue”, “expects”, “focus”, “goal”, “guidance”, “on plan”, “on schedule”, “on track”, “opportunity”, “plan”, “potential”, “priority”, “progress”, “target”, “upside”, or variations of or similar such words and phrases or statements that certain actions, events or results may, could, should or will be achieved, received or taken, or will occur or result and similar such expressions identify forward-looking statements. Forward-looking statements are necessarily based upon a number of estimates and assumptions that, while considered reasonable by Kinross as of the date of such statements, are inherently subject to significant business, economic and competitive uncertainties and contingencies. The estimates, models and assumptions of Kinross referenced, contained or incorporated by reference in this news release, which may prove to be incorrect, include, but are not limited to, the various assumptions set forth herein and in our Management’s Discussion and Analysis (“MD&A”) for the year ended December 31, 2024, and the Annual Information Form dated March 27, 2025 as well as: (1) there being no significant disruptions affecting the operations of the Company, whether due to extreme weather events and other or related natural disasters, labour disruptions (including but not limited to strikes or workforce reductions), supply disruptions, power disruptions, damage to equipment, pit wall slides or otherwise; (2) permitting, development, operations and production from the Company’s operations and development projects being consistent with Kinross’ current expectations including, without limitation: the maintenance of existing permits and approvals and the timely receipt of all permits and authorizations necessary for construction and operations; water and power supply and continued operation of the tailings reprocessing facility at Paracatu; permitting of the Great Bear project (including the consultation process with Indigenous groups), permitting and development of the Lobo-Marte project; in each case in a manner consistent with the Company’s expectations; and the successful completion of exploration consistent with the Company’s expectations at the Company’s projects; (3) political regulatory and legal developments in any jurisdiction in which the Company operates being consistent with its current expectations including, without limitation, restrictions or penalties imposed, or actions taken, by any government, including but not limited to amendments to the mining laws, and potential power rationing and tailings facility regulations in Brazil (including those related to financial assurance requirements), potential amendments to water laws and/or other water use restrictions and regulatory actions in Chile, new dam safety regulations, potential amendments to minerals and mining laws and energy levies laws, new regulations relating to work permits, potential amendments to customs and mining laws (including but not limited to amendments to the VAT) and the potential application of the tax code in Mauritania, potential amendments to and enforcement of tax laws in Mauritania (including, but not limited to, the interpretation, implementation, application and enforcement of any such laws and amendments thereto), substantial changes to the federal and/or provincial regulatory and permitting regimes in Canada, potential third party legal challenges to existing permits, and the impact of any trade tariffs being consistent with Kinross’ current expectations; (4) the completion of studies and the results of those studies being consistent with Kinross’ current expectations; (5) the exchange rate between the Canadian dollar, Brazilian real, Chilean peso, Mauritanian ouguiya and the U.S. dollar being approximately consistent with current levels; (6) certain price assumptions for gold and silver which includes, as it relates to share repurchases, assumptions that prices for gold and silver remain approximately consistent with current levels; (7) prices for diesel, natural gas, fuel oil, electricity and other key supplies being approximately consistent with the Company’s expectations; (8) attributable production and cost of sales forecasts for the Company meeting expectations; (9) the accuracy of the current mineral reserve and mineral resource estimates of the Company and Kinross’ analysis thereof being consistent with expectations (including but not limited to ore tonnage and ore grade estimates), future mineral resource and mineral reserve estimates being consistent with preliminary work undertaken by the Company, mine plans for the Company’s current and future mining operations, and the Company’s internal models; (10) labour and materials costs increasing on a basis consistent with Kinross’ current expectations; (11) the terms and conditions of the legal and fiscal stability agreements for Tasiast being interpreted and applied in a manner consistent with their intent and Kinross’ expectations and without material amendment or formal dispute (including without limitation the application of tax, customs and duties exemptions and royalties); (12) asset impairment potential; (13) the regulatory and legislative regime regarding mining, electricity production and transmission (including rules related to power tariffs) in Brazil being consistent with Kinross’ current expectations; (14) access to capital markets, including but not limited to maintaining our current credit ratings consistent with the Company’s current expectations; (15) potential direct or indirect operational impacts resulting from infectious diseases or pandemics; (16) changes in national and local government legislation or other government actions, including the Canadian federal impact assessment regime; (17) litigation, regulatory proceedings and audits, and the potential ramifications thereof, being concluded in a manner consistent with the Company’s expectations (including without limitation litigation in Chile relating to the alleged damage of wetlands and the scope of any remediation plan or other environmental obligations arising therefrom); (18) the Company’s financial results, cash flows and future prospects being consistent with Company expectations in amounts sufficient to permit sustained dividend payments; (19) the impacts of potential geotechnical instability being consistent with the Company’s expectations; and (20) the impacts of groundwater inflows at the La Coipa pits being consistent with the Company’s expectations. Known and unknown factors could cause actual results to differ materially from those projected in the forward-looking statements. Such factors include, but are not limited to: the inaccuracy of any of the foregoing assumptions; fluctuations in the currency markets; fluctuations in the spot and forward price of gold or certain other commodities (such as fuel and electricity); price inflation of goods and services; changes in the discount rates applied to calculate the present value of net future cash flows based on country-specific real weighted average cost of capital; changes in the market valuations of peer group gold producers and the Company, and the resulting impact on market price to net asset value multiples; changes in various market variables, such as interest rates, foreign exchange rates, gold or silver prices and lease rates, or global fuel prices, that could impact the mark-to-market value of outstanding derivative instruments and ongoing payments/receipts under any financial obligations; risks arising from holding derivative instruments (such as credit risk, market liquidity risk and mark-to-market risk); changes in national and local government legislation, taxation (including but not limited to income tax, advance income tax, stamp tax, withholding tax, capital tax, tariffs, value-added or sales tax, capital outflow tax, capital gains tax, windfall or windfall profits tax, production royalties, excise tax, customs/import or export taxes/duties, asset taxes, asset transfer tax, property use or other real estate tax, together with any related fine, penalty, surcharge, or interest imposed in connection with such taxes), controls, tariffs, policies and regulations; the security of personnel and assets; political or economic developments in Canada, the United States, Chile, Brazil, Mauritania or other countries in which Kinross does business or may carry on business; business opportunities that may be presented to, or pursued by, us; our ability to successfully integrate acquisitions and complete divestitures; operating or technical difficulties in connection with mining, development or refining activities; employee relations; litigation or other claims against, or regulatory investigations and/or any enforcement actions, administrative orders or sanctions in respect of the Company (and/or its directors, officers, or employees) including, but not limited to, securities class action litigation in Canada and/or the United States, environmental litigation or regulatory proceedings or any investigations, enforcement actions and/or sanctions under any applicable anti-corruption, international sanctions and/or anti-money laundering laws and regulations in Canada, the United States or any other applicable jurisdiction; the speculative nature of gold exploration and development including, but not limited to, the risks of obtaining and maintaining necessary licenses and permits; diminishing quantities or grades of reserves; adverse changes in our credit ratings; and contests over title to properties, particularly title to undeveloped properties. In addition, there are risks and hazards associated with the business of gold exploration, development and mining, including environmental hazards, industrial accidents, unusual or unexpected formations, pressures, cave-ins, flooding and gold bullion losses (and the risk of inadequate insurance, or the inability to obtain insurance, to cover these risks). Many of these uncertainties and contingencies can directly or indirectly affect, and could cause, Kinross’ actual results to differ materially from those expressed or implied in any forward-looking statements made by, or on behalf of, Kinross, including but not limited to resulting in an impairment charge on goodwill and/or assets. There can be no assurance that forward-looking statements will prove to be accurate, as actual results and future events could differ materially from those anticipated in such statements. Forward-looking statements are provided for the purpose of providing information about management’s expectations and plans relating to the future. All of the forward-looking statements made in this news release are qualified by this cautionary statement and those made in our other filings with the securities regulators of Canada and the United States including, but not limited to, the cautionary statements made in the “Risk Analysis” section of our MD&A for the year ended December 31, 2024, and the “Risk Factors” set forth in the Company’s Annual Information Form dated March 27, 2025. These factors are not intended to represent a complete list of the factors that could affect Kinross. Kinross disclaims any intention or obligation to update or revise any forward-looking statements or to explain any material difference between subsequent actual events and such forward-looking statements, except to the extent required by applicable law.
Key Sensitivities
Approximately 70%-80% of the Company's costs are denominated in U.S. dollars.
A 10% change in foreign currency exchange rates would be expected to result in an approximate $25 impact on attributable production cost of sales per equivalent ounce sold1, 11.
Specific to the Brazilian real, a 10% change in the exchange rate would be expected to result in an approximate $45 impact on Brazilian attributable production cost of sales per equivalent ounce sold1.
Specific to the Chilean peso, a 10% change in the exchange rate would be expected to result in an approximate $50 impact on Chilean attributable production cost of sales per equivalent ounce sold1.
A $10 per barrel change in the price of oil would be expected to result in an approximate $3 impact on attributable production cost of sales per equivalent ounce sold1.
A $100 change in the price of gold would be expected to result in an approximate $5 impact on attributable production cost of sales per equivalent ounce sold1 as a result of a change in royalties.
Other information
Where we say "we", "us", "our", the "Company", or "Kinross" in this news release, we mean Kinross Gold Corporation and/or one or more or all of its subsidiaries, as may be applicable.
The technical information about the Company’s mineral properties contained in this news release has been prepared under the supervision of Mr. Nicos Pfeiffer, an officer of the Company who is a “qualified person” within the meaning of National Instrument 43-101.
Source: Kinross Gold Corporation
__________________________________
1 Unless otherwise stated, production figures in this news release are on an attributable basis. “Attributable” includes Kinross’ 70% share of Manh Choh production, costs, cash flows and capital expenditures. Financial figures include 100% of Manh Choh results except when denoted as attributable. Attributable figures are non-GAAP financial measures and ratios. Refer to footnote 6.
2 “Production cost of sales per equivalent ounce sold” is defined as production cost of sales, as reported on the interim condensed consolidated statements of operations, divided by total gold equivalent ounces sold.
3 Operating cash flow figures in this release represent “Net cash flow provided from operating activities,” as reported on the interim condensed consolidated statements of cash flows.
4 “Margins” per equivalent ounce sold is defined as average realized gold price per ounce less production cost of sales per equivalent ounce sold.
5 Earnings, net earnings, and reported net earnings figures in this news release represent “Net earnings attributable to common shareholders,” as reported on the interim condensed consolidated statements of operations.
6 These figures are non-GAAP financial measures and ratios, as applicable, and are defined and reconciled on pages 16 to 21 of this news release. Non-GAAP financial measures and ratios have no standardized meaning under International Financial Reporting Standards (“IFRS”) and therefore, may not be comparable to similar measures presented by other issuers.
7 “Total liquidity” is defined as the sum of cash and cash equivalents, as reported on the interim condensed consolidated balance sheets, and available credit under the Company’s credit facilities (as calculated in Section 6 Liquidity and Capital Resources of Kinross’ MD&A for the three and six months ended June 30, 2025).
8 “Average realized gold price per ounce” is defined as gold revenue divided by total gold ounces sold.
9 Net debt is calculated as long-term debt of $1,236.4 million less cash and cash equivalents of $1,136.5 million, as reported on the Company’s consolidated balance sheet as at June 30, 2025.
10 “Available credit” is defined as available credit under the Company’s credit facilities and is calculated in Section 6 Liquidity and Capital Resources of Kinross’ MD&A for the three and six months ended June 30, 2025.
11 Refers to all of the currencies in the countries where the Company has mining operations, fluctuating simultaneously by 10% in the same direction, either appreciating or depreciating, taking into consideration the impact of hedging and the weighting of each currency within our consolidated cost structure.

![]()