

Aerospace and defense company Raytheon (NYSE: RTX) reported Q4 CY2024 results exceeding the market’s revenue expectations, with sales up 8.5% year on year to $21.62 billion. On the other hand, the company’s full-year revenue guidance of $83.5 billion at the midpoint came in 1% below analysts’ estimates. Its non-GAAP profit of $1.54 per share was 12% above analysts’ consensus estimates.
Is now the time to buy RTX? Find out by accessing our full research report, it’s free.
RTX (RTX) Q4 CY2024 Highlights:
- Revenue: $21.62 billion vs analyst estimates of $20.52 billion (8.5% year-on-year growth, 5.4% beat)
- Adjusted EPS: $1.54 vs analyst estimates of $1.38 (12% beat)
- Adjusted EBITDA: $3.36 billion vs analyst estimates of $3.24 billion (15.5% margin, 3.6% beat)
- Management’s revenue guidance for the upcoming financial year 2025 is $83.5 billion at the midpoint, missing analyst estimates by 1% and implying 3.4% growth (vs 19.4% in FY2024)
- Adjusted EPS guidance for the upcoming financial year 2025 is $6.08 at the midpoint, in line with analyst estimates
- Operating Margin: 9.8%, in line with the same quarter last year
- Free Cash Flow Margin: 2.3%, down from 19.6% in the same quarter last year
- Organic Revenue rose 11% year on year, in line with the same quarter last year
- Market Capitalization: $166.4 billion
"RTX delivered a very strong year of performance in 2024 with 11 percent organic sales growth* and 13 percent adjusted EPS growth*, including segment margin expansion* in all three businesses," said RTX President and CEO Chris Calio.
Company Overview
Originally focused on refrigeration technology, Raytheon (NSYE:RTX) provides a a variety of products and services to the aerospace and defense industries.
Defense Contractors
Defense contractors typically require technical expertise and government clearance. Companies in this sector can also enjoy long-term contracts with government bodies, leading to more predictable revenues. Combined, these factors create high barriers to entry and can lead to limited competition. Lately, geopolitical tensions–whether it be Russia’s invasion of Ukraine or China’s aggression towards Taiwan–highlight the need for defense spending. On the other hand, demand for these products can ebb and flow with defense budgets and even who is president, as different administrations can have vastly different ideas of how to allocate federal funds.
Sales Growth
Examining a company’s long-term performance can provide clues about its quality. Any business can put up a good quarter or two, but the best consistently grow over the long haul. Luckily, RTX’s sales grew at a solid 9.2% compounded annual growth rate over the last five years. Its growth beat the average industrials company and shows its offerings resonate with customers.
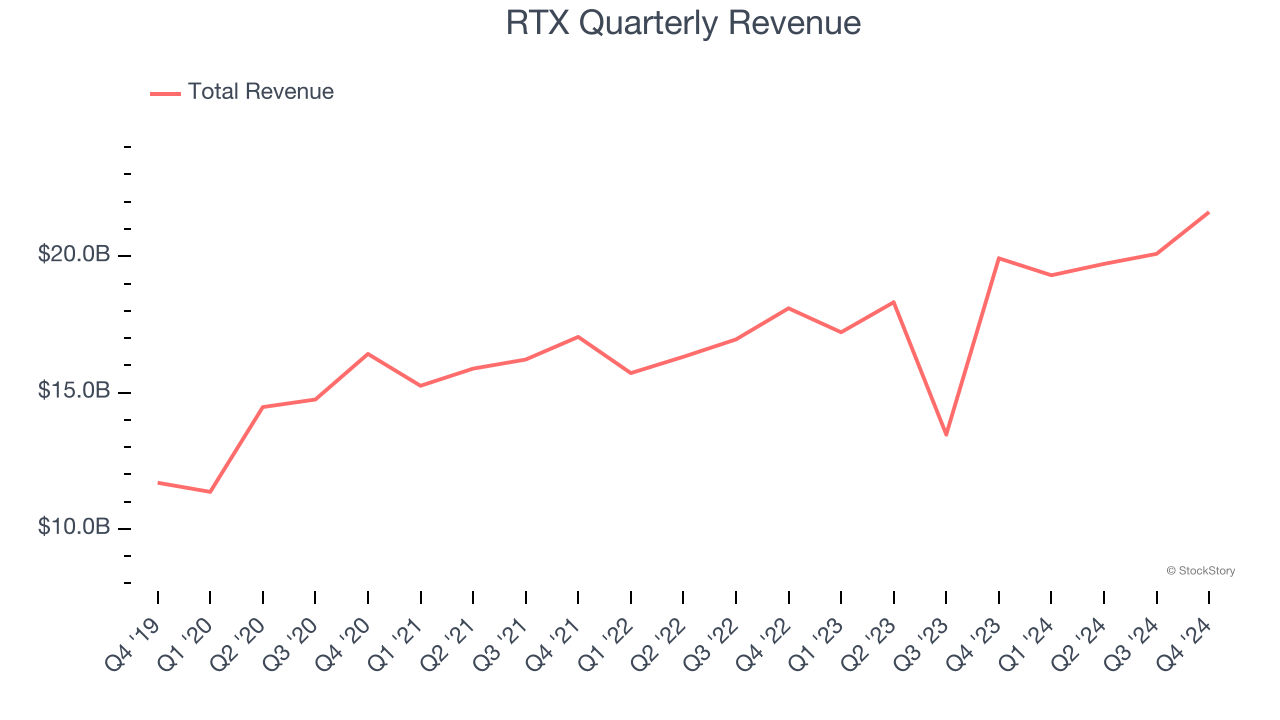
We at StockStory place the most emphasis on long-term growth, but within industrials, a half-decade historical view may miss cycles, industry trends, or a company capitalizing on catalysts such as a new contract win or a successful product line. RTX’s annualized revenue growth of 9.7% over the last two years aligns with its five-year trend, suggesting its demand was predictably strong. 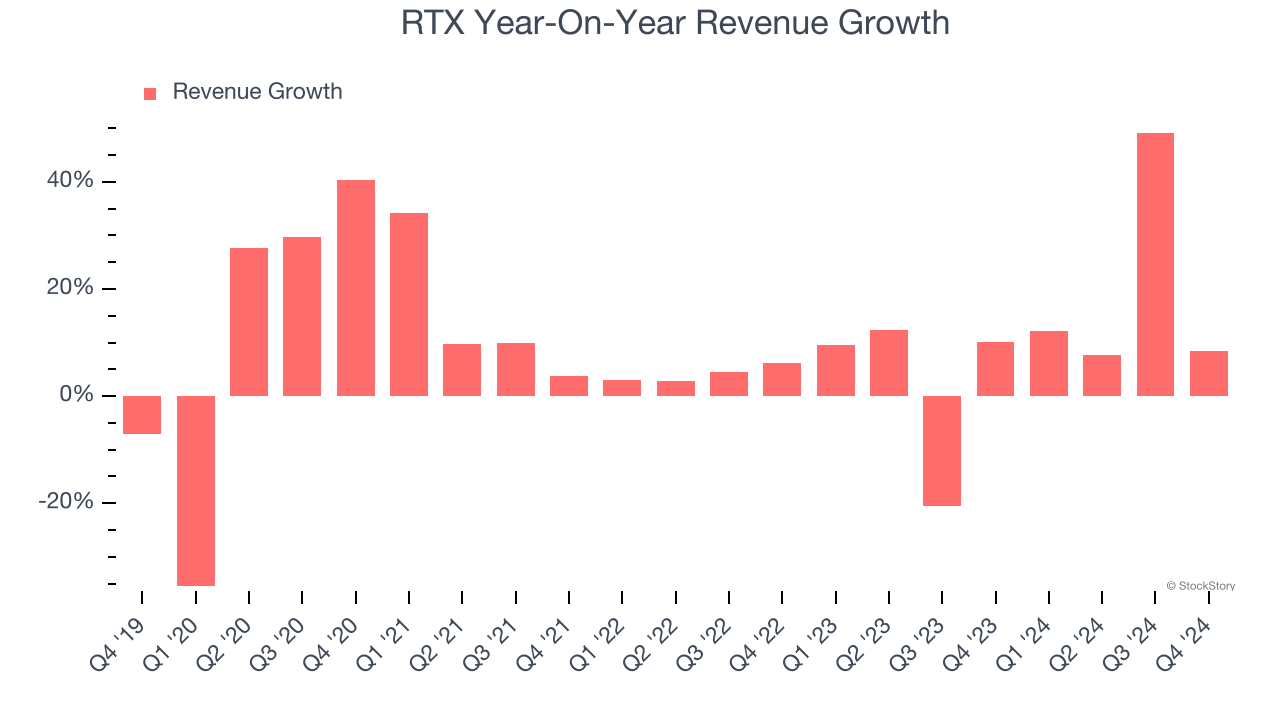
We can better understand the company’s sales dynamics by analyzing its organic revenue, which strips out one-time events like acquisitions and currency fluctuations because they don’t accurately reflect its fundamentals. Over the last two years, RTX’s organic revenue averaged 11.6% year-on-year growth. Because this number is better than its normal revenue growth, we can see that some mixture of divestitures and foreign exchange rates dampened its headline results. 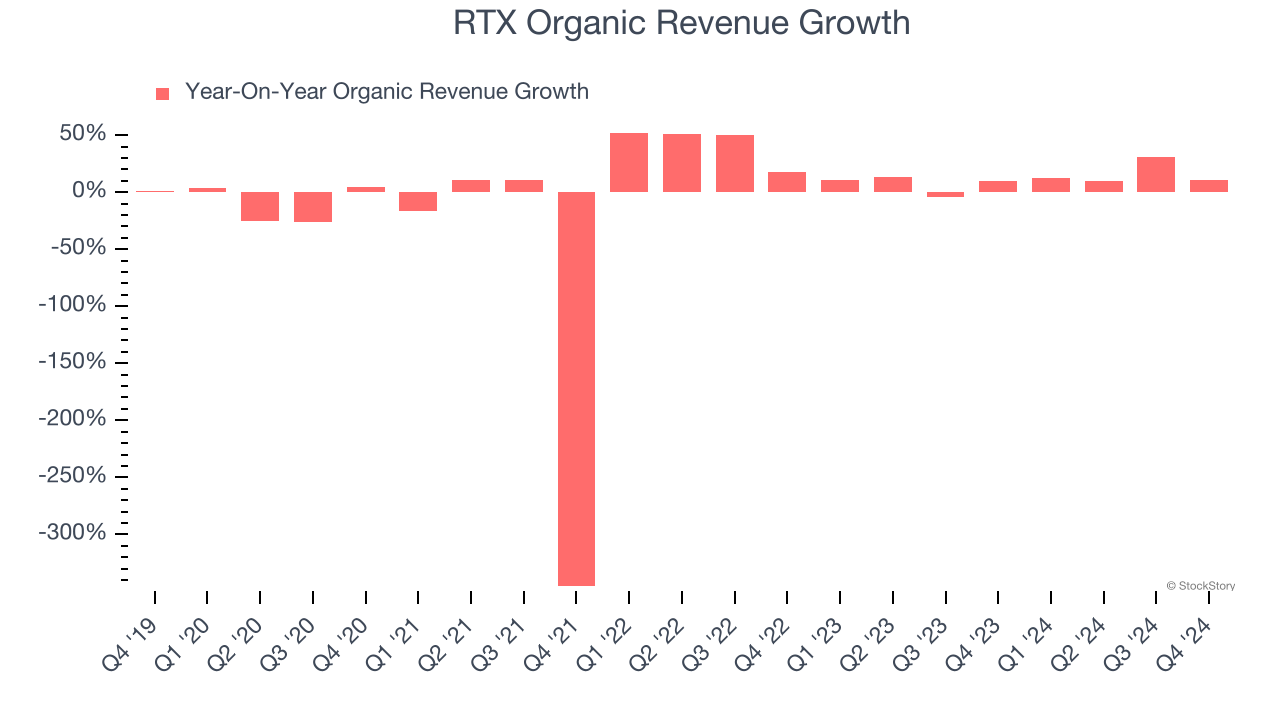
This quarter, RTX reported year-on-year revenue growth of 8.5%, and its $21.62 billion of revenue exceeded Wall Street’s estimates by 5.4%.
Looking ahead, sell-side analysts expect revenue to grow 4.3% over the next 12 months, a deceleration versus the last two years. This projection is underwhelming and suggests its products and services will face some demand challenges.
Unless you’ve been living under a rock, it should be obvious by now that generative AI is going to have a huge impact on how large corporations do business. While Nvidia and AMD are trading close to all-time highs, we prefer a lesser-known (but still profitable) stock benefiting from the rise of AI. Click here to access our free report one of our favorites growth stories.
Operating Margin
Operating margin is an important measure of profitability as it shows the portion of revenue left after accounting for all core expenses–everything from the cost of goods sold to advertising and wages. It’s also useful for comparing profitability across companies with different levels of debt and tax rates because it excludes interest and taxes.
RTX was profitable over the last five years but held back by its large cost base. Its average operating margin of 5.5% was weak for an industrials business.
On the plus side, RTX’s operating margin rose by 11.4 percentage points over the last five years, as its sales growth gave it immense operating leverage.
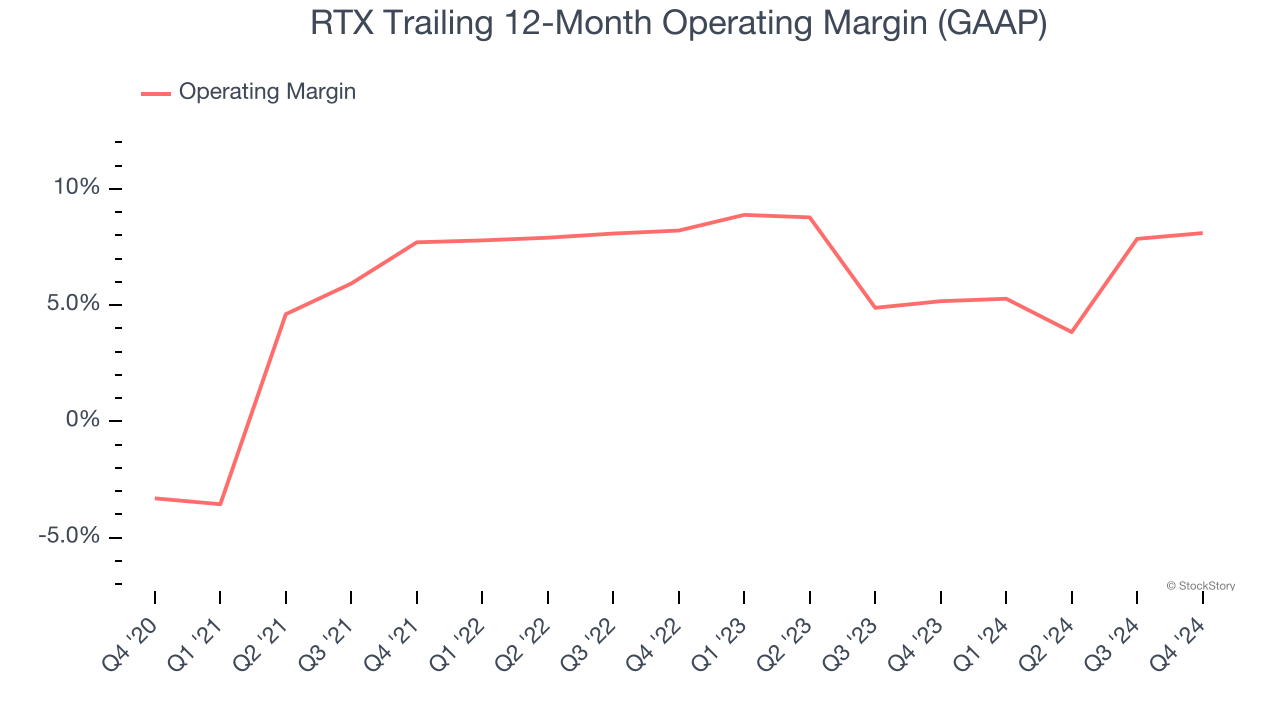
In Q4, RTX generated an operating profit margin of 9.8%, in line with the same quarter last year. This indicates the company’s overall cost structure has been relatively stable.
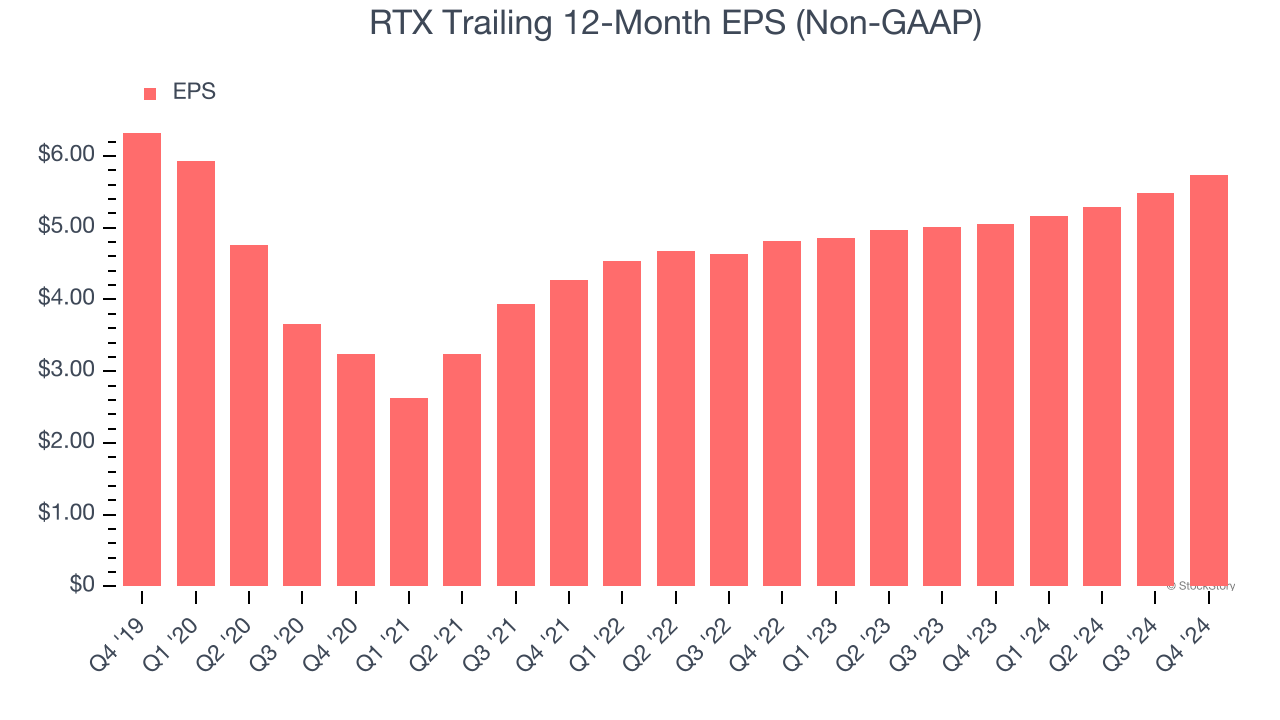
Earnings Per Share
We track the long-term change in earnings per share (EPS) for the same reason as long-term revenue growth. Compared to revenue, however, EPS highlights whether a company’s growth is profitable.
Sadly for RTX, its EPS declined by 1.9% annually over the last five years while its revenue grew by 9.2%. However, its operating margin actually expanded during this timeframe, telling us that non-fundamental factors such as interest and taxes affected its ultimate earnings.
We can take a deeper look into RTX’s earnings to better understand the drivers of its performance. A five-year view shows RTX has diluted its shareholders, growing its share count by 55.6%. This dilution overshadowed its increased operating efficiency and has led to lower per share earnings. Taxes and interest expenses can also affect EPS but don’t tell us as much about a company’s fundamentals. 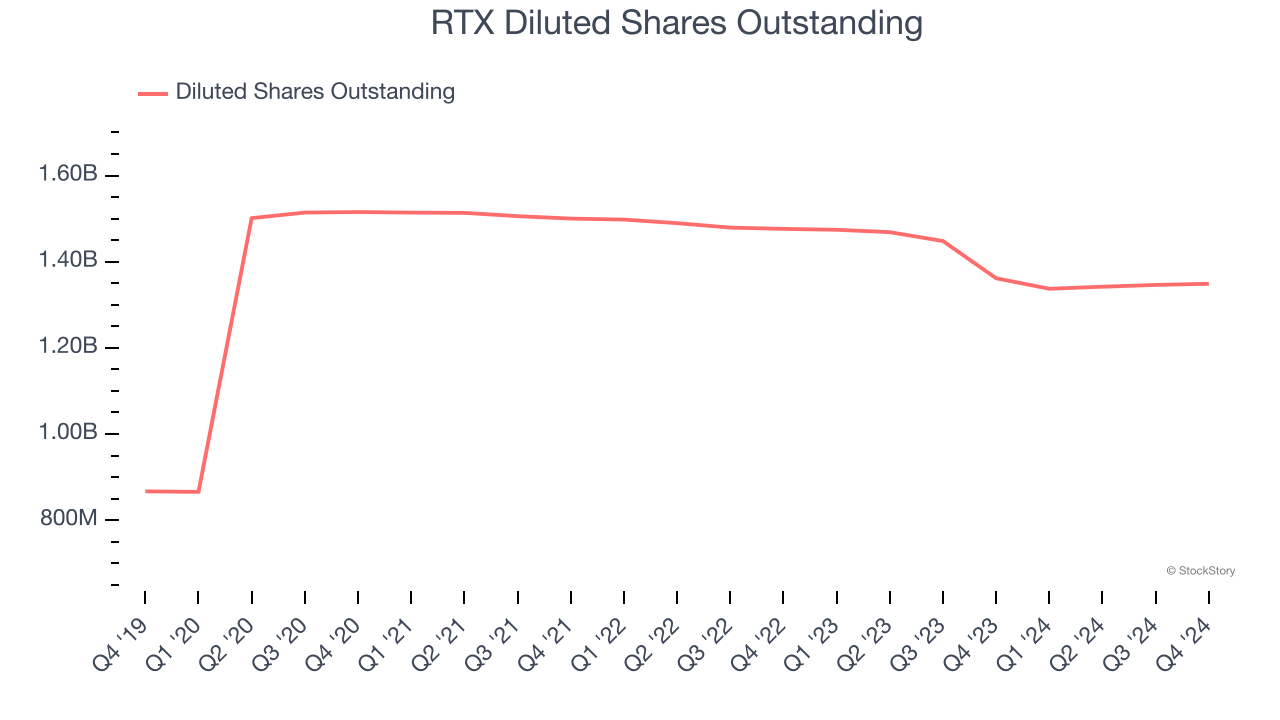
Like with revenue, we analyze EPS over a more recent period because it can provide insight into an emerging theme or development for the business.
For RTX, its two-year annual EPS growth of 9.2% was higher than its five-year trend. Accelerating earnings growth is almost always an encouraging data point.
In Q4, RTX reported EPS at $1.54, up from $1.29 in the same quarter last year. This print easily cleared analysts’ estimates, and shareholders should be content with the results. Over the next 12 months, Wall Street expects RTX’s full-year EPS of $5.74 to grow 6.8%.
Key Takeaways from RTX’s Q4 Results
We liked that RTX beat analysts’ organic revenue expectations this quarter. We were also excited its revenue outperformed Wall Street’s estimates by a nice margin. On the other hand, its full-year revenue guidance slightly missed and full-year EPS guidance was in line. Overall, we think this was a solid quarter with mixed guidance. The stock remained flat at $124.50 immediately following the results.
Is RTX an attractive investment opportunity at the current price? What happened in the latest quarter matters, but not as much as longer-term business quality and valuation, when deciding whether to invest in this stock. We cover that in our actionable full research report which you can read here, it’s free.


