

Electric vehicle manufacturer Rivian (NASDAQ: RIVN) beat Wall Street’s revenue expectations in Q3 CY2025, with sales up 78.3% year on year to $1.56 billion. Its non-GAAP loss of $0.65 per share was 9% above analysts’ consensus estimates.
Is now the time to buy Rivian? Find out by accessing our full research report, it’s free for active Edge members.
Rivian (RIVN) Q3 CY2025 Highlights:
- Revenue: $1.56 billion vs analyst estimates of $1.49 billion (78.3% year-on-year growth, 4.9% beat)
- Adjusted EPS: -$0.65 vs analyst estimates of -$0.71 (9% beat)
- Adjusted EBITDA: -$602 million vs analyst estimates of -$567.9 million (-38.6% margin, 6% miss)
- EBITDA guidance for the full year is -$2.13 billion at the midpoint, above analyst estimates of -$2.12 billion
- Operating Margin: -63.1%, up from -134% in the same quarter last year
- Free Cash Flow was -$421 million compared to -$1.15 billion in the same quarter last year
- Sales Volumes rose 31.8% year on year (-35.6% in the same quarter last year)
- Market Capitalization: $15.17 billion
Company Overview
The manufacturer of Amazon’s delivery trucks, Rivian (NASDAQ: RIVN) designs, manufactures, and sells electric vehicles and commercial delivery vans.
Revenue Growth
Examining a company’s long-term performance can provide clues about its quality. Even a bad business can shine for one or two quarters, but a top-tier one grows for years. Luckily, Rivian’s sales grew at an incredible 171% compounded annual growth rate over the last three years. Its growth surpassed the average industrials company and shows its offerings resonate with customers, a great starting point for our analysis.
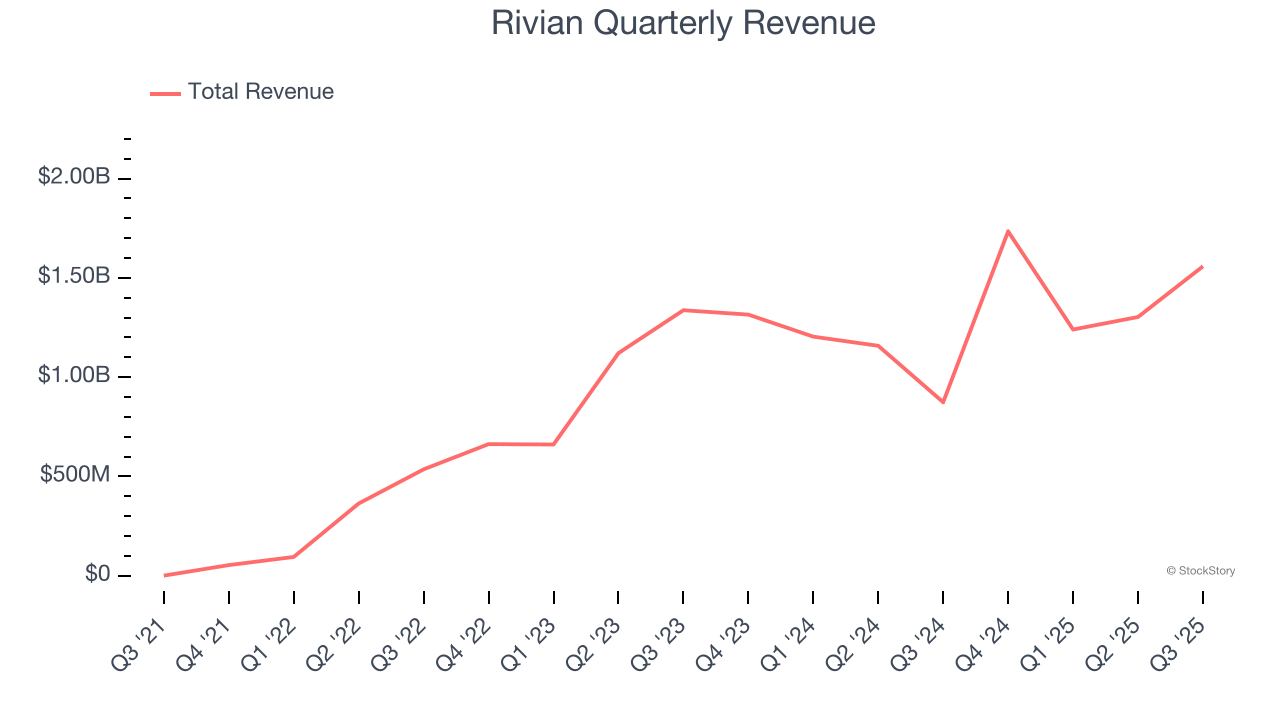
Long-term growth is the most important, but within industrials, a stretched historical view may miss new industry trends or demand cycles. Rivian’s annualized revenue growth of 24.2% over the last two years is below its three-year trend, but we still think the results suggest healthy demand. 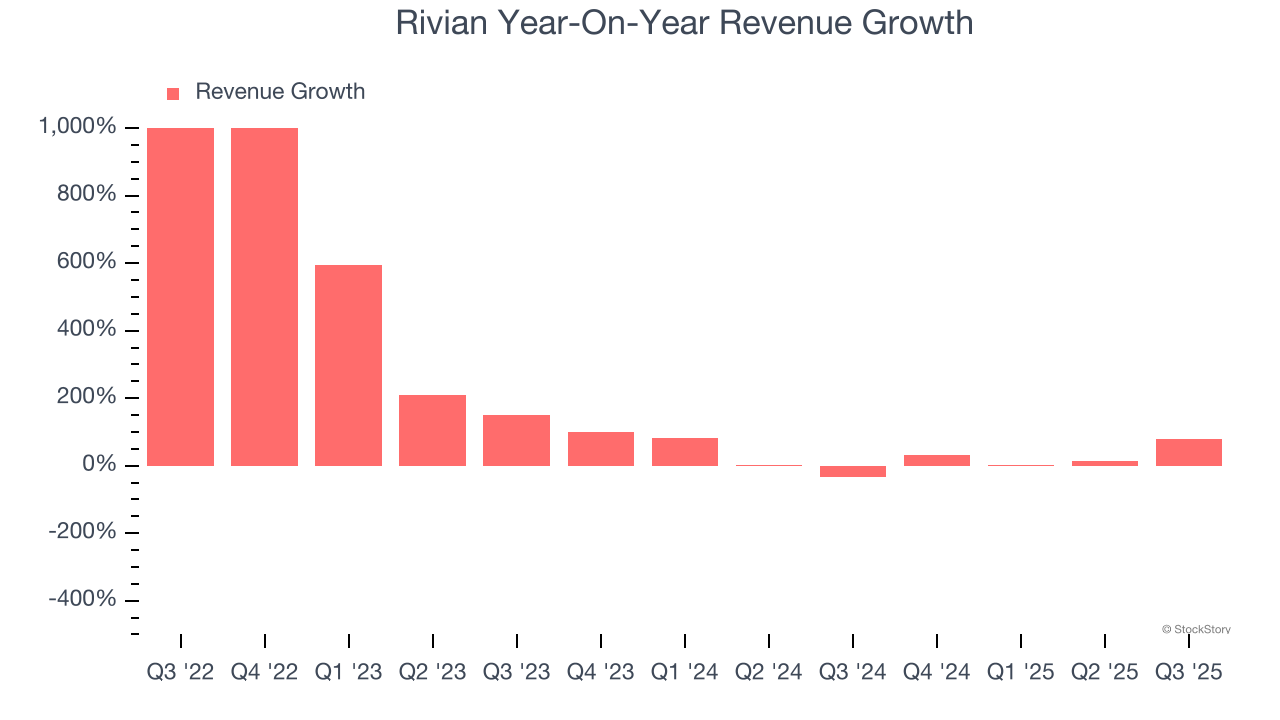
We can better understand the company’s revenue dynamics by analyzing its number of vehicles delivered, which reached 13,201 in the latest quarter. Over the last two years, Rivian’s vehicles delivered grew by 2.8% annually. Because this number is lower than its revenue growth, we can see the company benefited from price increases. 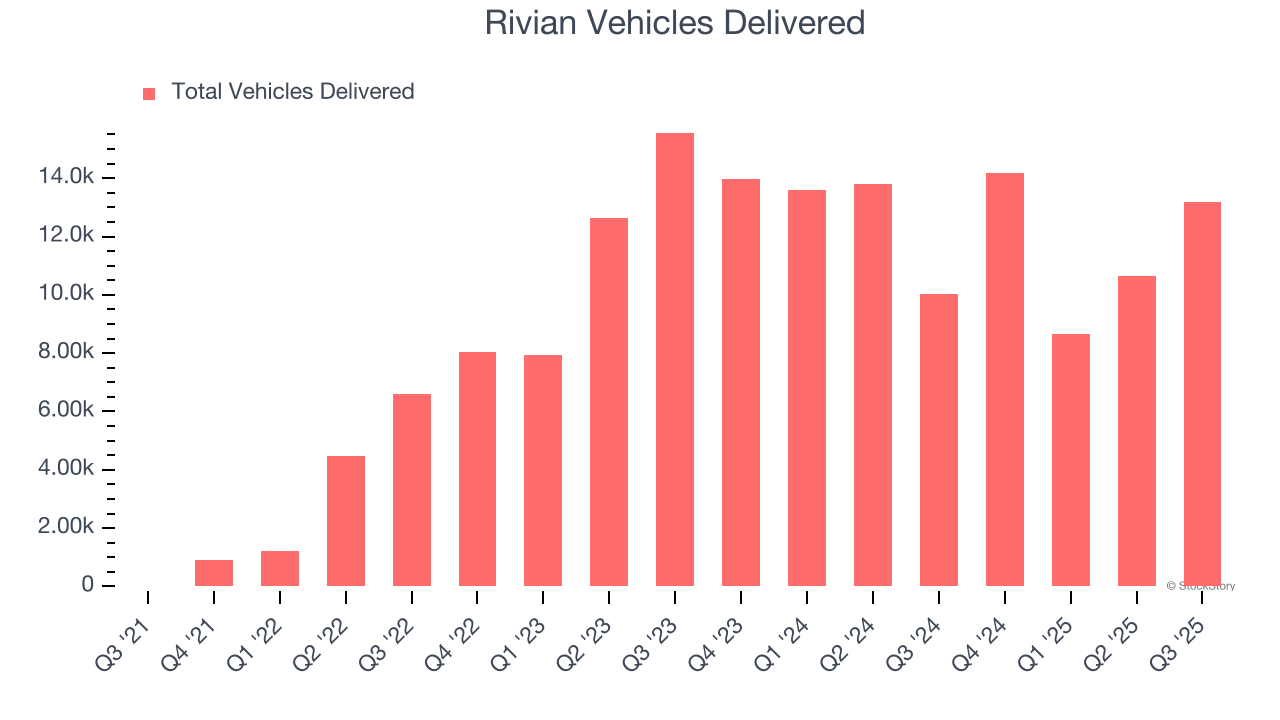
This quarter, Rivian reported magnificent year-on-year revenue growth of 78.3%, and its $1.56 billion of revenue beat Wall Street’s estimates by 4.9%.
Looking ahead, sell-side analysts expect revenue to grow 1.2% over the next 12 months, a deceleration versus the last two years. This projection doesn't excite us and suggests its products and services will see some demand headwinds. At least the company is tracking well in other measures of financial health.
Microsoft, Alphabet, Coca-Cola, Monster Beverage—all began as under-the-radar growth stories riding a massive trend. We’ve identified the next one: a profitable AI semiconductor play Wall Street is still overlooking. Go here for access to our full report.
Operating Margin
Operating margin is an important measure of profitability as it shows the portion of revenue left after accounting for all core expenses – everything from the cost of goods sold to advertising and wages. It’s also useful for comparing profitability across companies with different levels of debt and tax rates because it excludes interest and taxes.
Rivian’s high expenses have contributed to an average operating margin of negative 148% over the last five years. Unprofitable industrials companies require extra attention because they could get caught swimming naked when the tide goes out.
On the plus side, Rivian’s operating margin rose over the last five years, as its sales growth gave it operating leverage. Still, it will take much more for the company to reach long-term profitability.
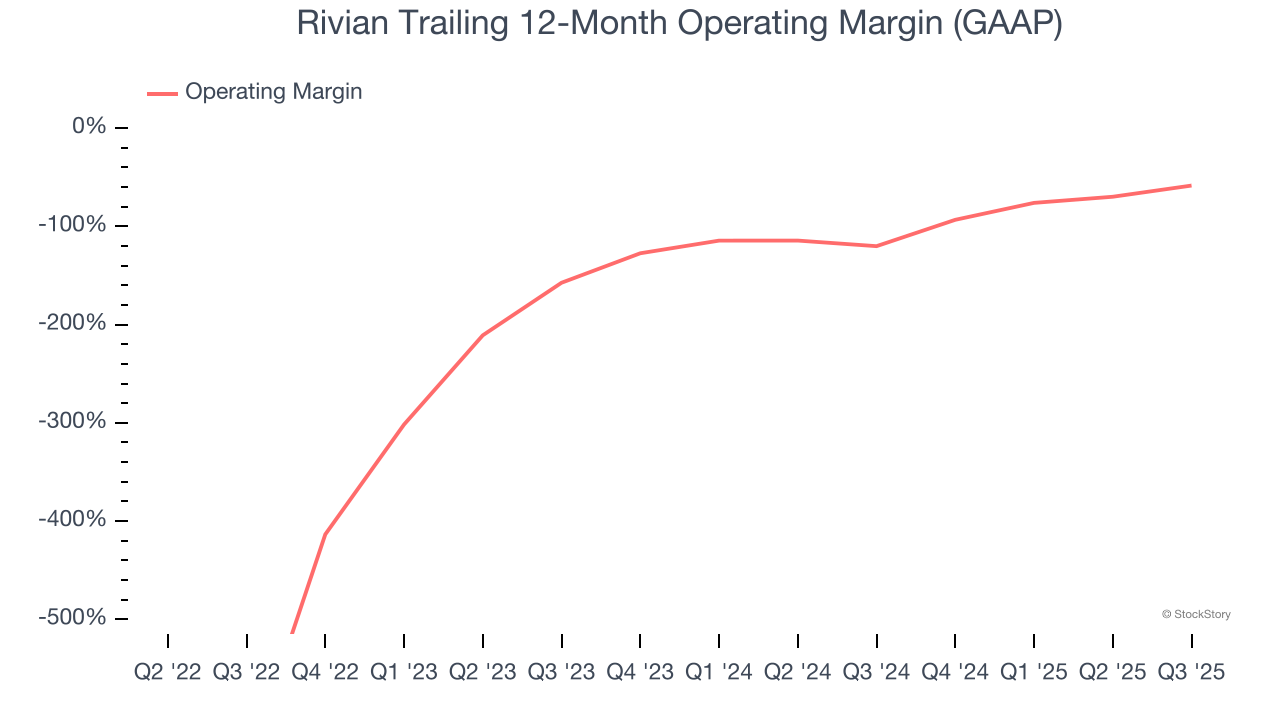
This quarter, Rivian generated a negative 63.1% operating margin.
Earnings Per Share
Revenue trends explain a company’s historical growth, but the change in earnings per share (EPS) points to the profitability of that growth – for example, a company could inflate its sales through excessive spending on advertising and promotions.
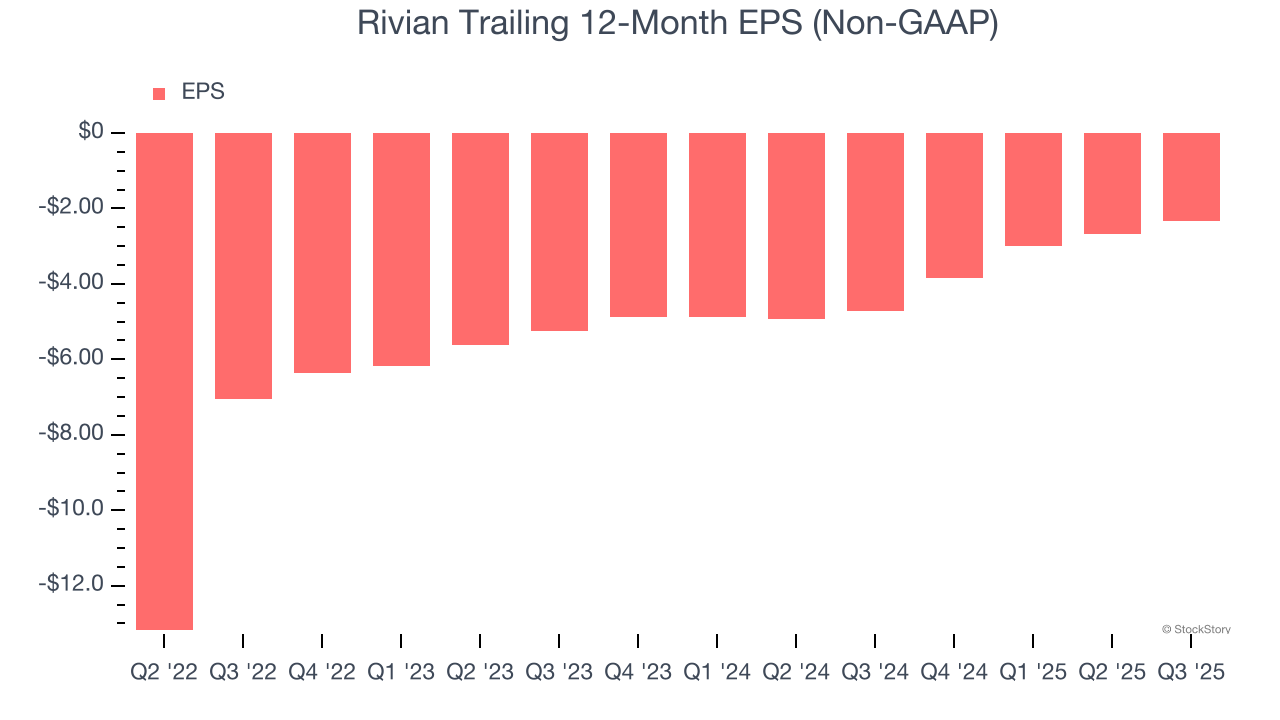
Although Rivian’s full-year earnings are still negative, it reduced its losses and improved its EPS by 33.4% annually over the last two years.
In Q3, Rivian reported adjusted EPS of negative $0.65, up from negative $0.99 in the same quarter last year. This print beat analysts’ estimates by 9%. Over the next 12 months, Wall Street expects Rivian to perform poorly. Analysts forecast its full-year EPS of negative $2.33 will tumble to negative $2.65.
Key Takeaways from Rivian’s Q3 Results
We were impressed by how significantly Rivian blew past analysts’ revenue expectations this quarter. We were also glad its EPS outperformed Wall Street’s estimates. On the other hand, its EBITDA missed and its full-year EBITDA guidance was in line with Wall Street’s estimates. Zooming out, we think this was a mixed quarter. The stock traded up 3.1% to $12.89 immediately following the results.
Big picture, is Rivian a buy here and now? If you’re making that decision, you should consider the bigger picture of valuation, business qualities, as well as the latest earnings. We cover that in our actionable full research report which you can read here, it’s free for active Edge members.


