

Healthcare distributor Cencora (NYSE: COR) reported Q3 CY2025 results beating Wall Street’s revenue expectations, with sales up 5.9% year on year to $83.73 billion. Its non-GAAP profit of $3.84 per share was 1.4% above analysts’ consensus estimates.
Is now the time to buy Cencora? Find out by accessing our full research report, it’s free for active Edge members.
Cencora (COR) Q3 CY2025 Highlights:
- Revenue: $83.73 billion vs analyst estimates of $83.28 billion (5.9% year-on-year growth, 0.5% beat)
- Adjusted EPS: $3.84 vs analyst estimates of $3.79 (1.4% beat)
- Adjusted EPS guidance for the upcoming financial year 2026 is $17.60 at the midpoint, beating analyst estimates by 0.7%
- Operating Margin: 0%, in line with the same quarter last year
- Free Cash Flow Margin: 3.4%, up from 1% in the same quarter last year
- Market Capitalization: $66.8 billion
“Cencora furthered key initiatives in fiscal 2025 to fortify our leading position in healthcare, most notably by enhancing our position in specialty through our acquisition of RCA as well as the decision to strategically refocus our existing business portfolio,” said Bob Mauch, President and Chief Executive Officer of Cencora.
Company Overview
Formerly known as AmerisourceBergen until its 2023 rebranding, Cencora (NYSE: COR) is a global pharmaceutical distribution company that connects manufacturers with healthcare providers while offering logistics, data analytics, and consulting services.
Revenue Growth
A company’s long-term performance is an indicator of its overall quality. Any business can put up a good quarter or two, but many enduring ones grow for years. Luckily, Cencora’s sales grew at a decent 11.1% compounded annual growth rate over the last five years. Its growth was slightly above the average healthcare company and shows its offerings resonate with customers.
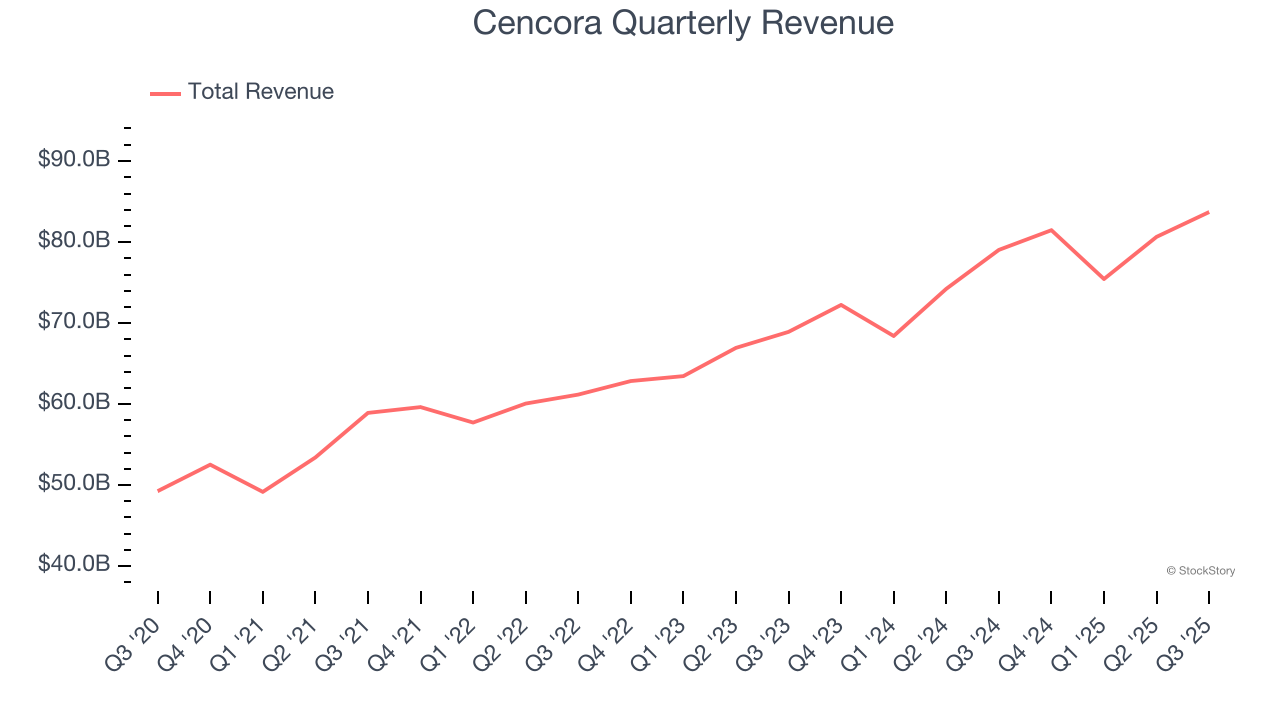
We at StockStory place the most emphasis on long-term growth, but within healthcare, a half-decade historical view may miss recent innovations or disruptive industry trends. Cencora’s annualized revenue growth of 10.7% over the last two years aligns with its five-year trend, suggesting its demand was stable. 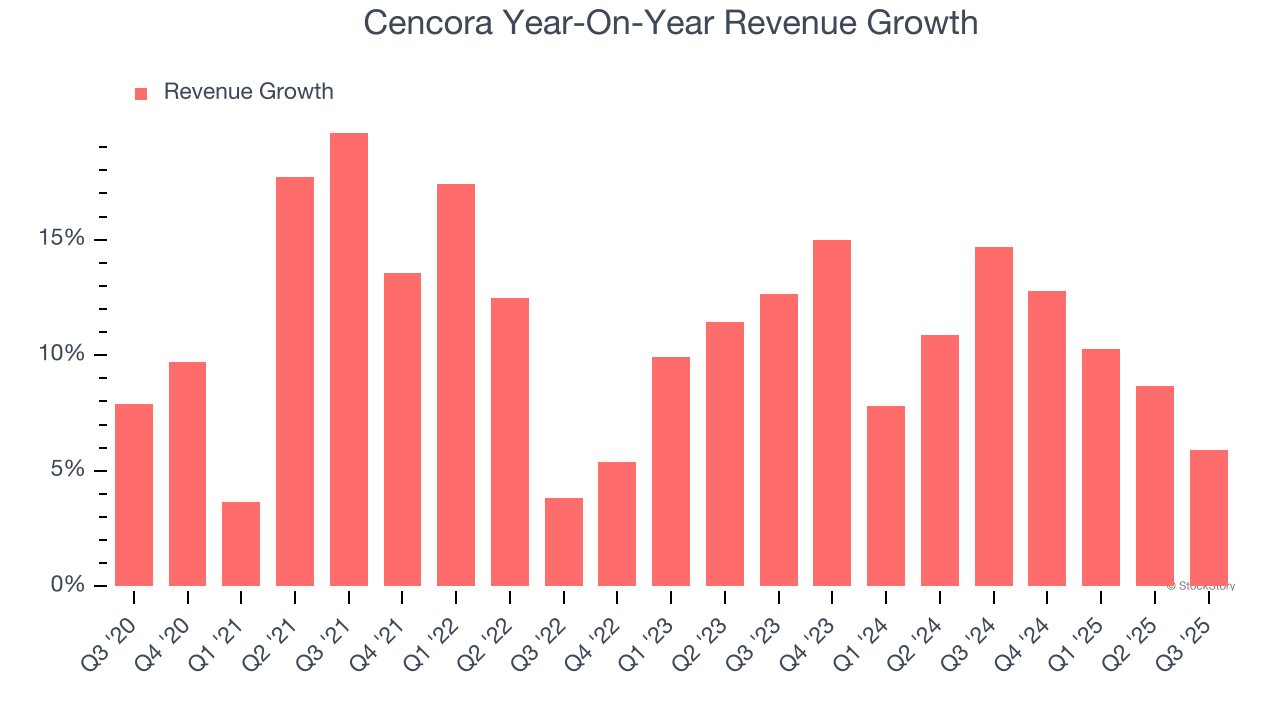
Cencora also breaks out the revenue for its most important segment, US Healthcare. Over the last two years, Cencora’s US Healthcare revenue averaged 11.4% year-on-year growth. 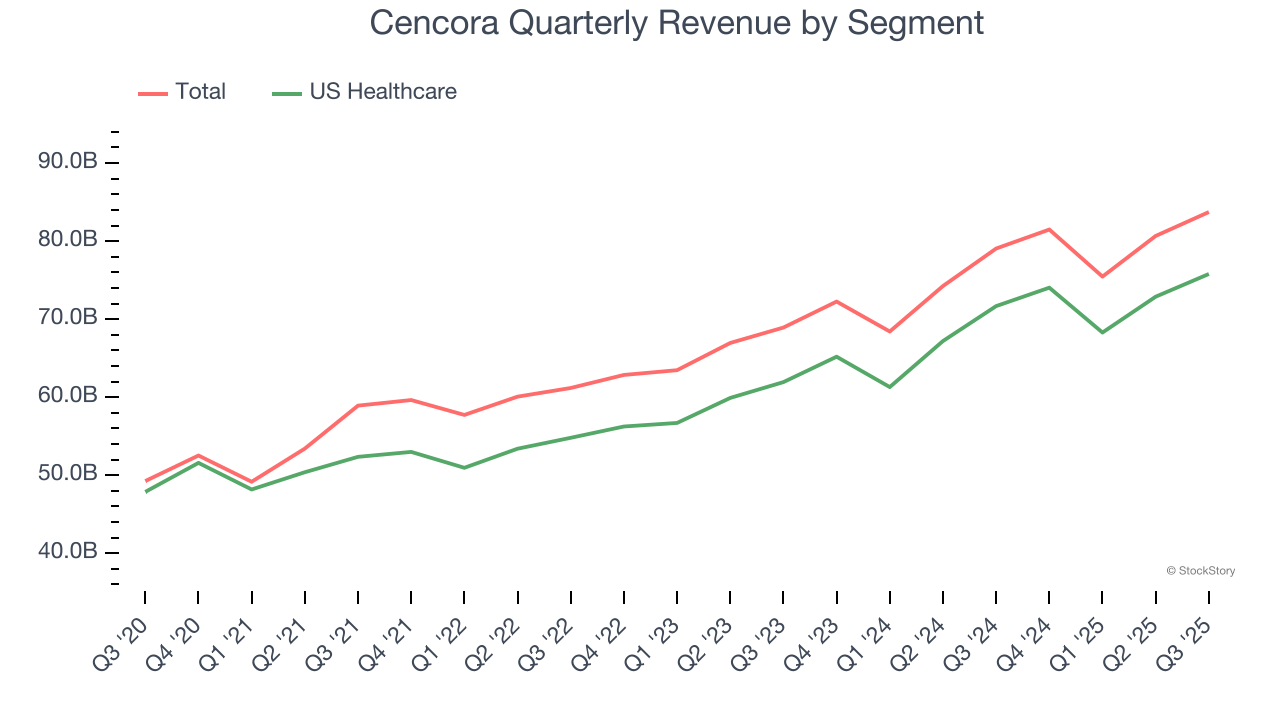
This quarter, Cencora reported year-on-year revenue growth of 5.9%, and its $83.73 billion of revenue exceeded Wall Street’s estimates by 0.5%.
Looking ahead, sell-side analysts expect revenue to grow 6.7% over the next 12 months, a deceleration versus the last two years. We still think its growth trajectory is satisfactory given its scale and suggests the market is baking in success for its products and services.
Microsoft, Alphabet, Coca-Cola, Monster Beverage—all began as under-the-radar growth stories riding a massive trend. We’ve identified the next one: a profitable AI semiconductor play Wall Street is still overlooking. Go here for access to our full report.
Operating Margin
Cencora’s operating margin might fluctuated slightly over the last 12 months but has generally stayed the same. The company broke even over the last five years, lousy for a healthcare business. Its large expense base and inefficient cost structure were the main culprits behind this performance.
Analyzing the trend in its profitability, Cencora’s operating margin might fluctuated slightly but has generally stayed the same over the last five years. This raises questions about the company’s expense base because its revenue growth should have given it leverage on its fixed costs, resulting in better economies of scale and profitability.
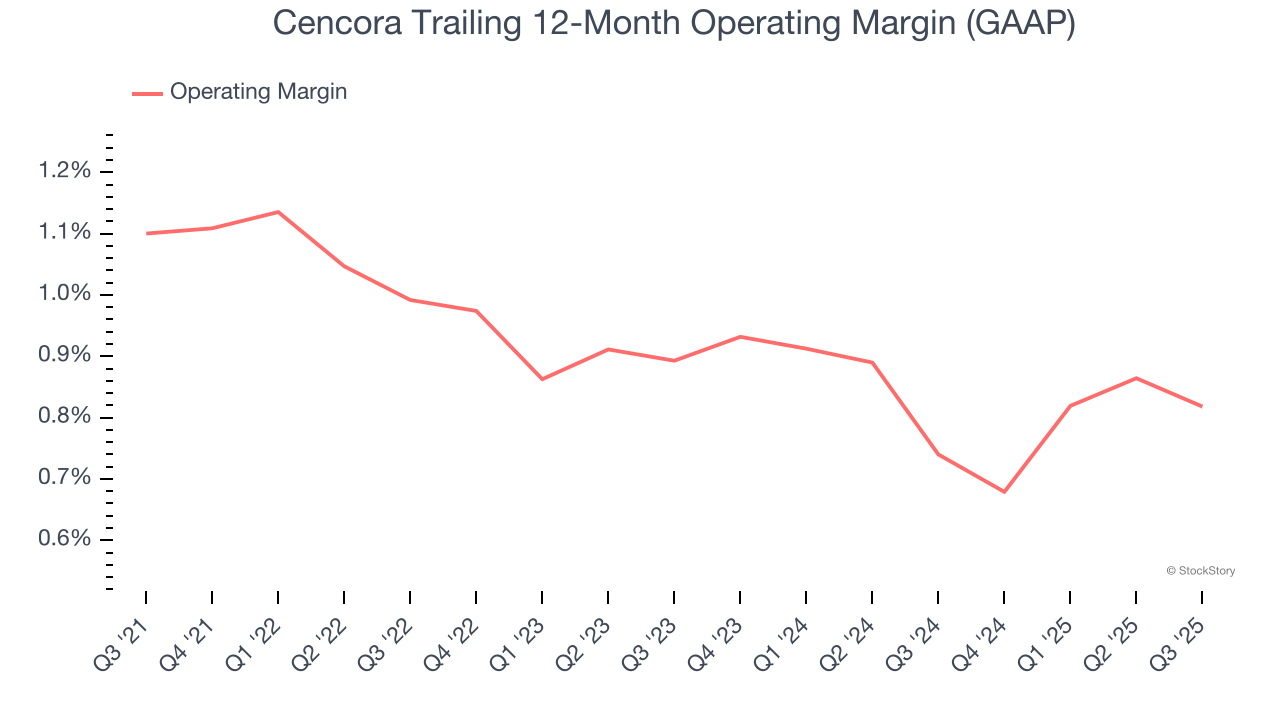
In Q3, Cencora’s breakeven margin was in line with the same quarter last year. This indicates the company’s overall cost structure has been relatively stable.
Earnings Per Share
We track the long-term change in earnings per share (EPS) for the same reason as long-term revenue growth. Compared to revenue, however, EPS highlights whether a company’s growth is profitable.
Cencora’s EPS grew at an astounding 15.1% compounded annual growth rate over the last five years, higher than its 11.1% annualized revenue growth. This tells us the company became more profitable on a per-share basis as it expanded.
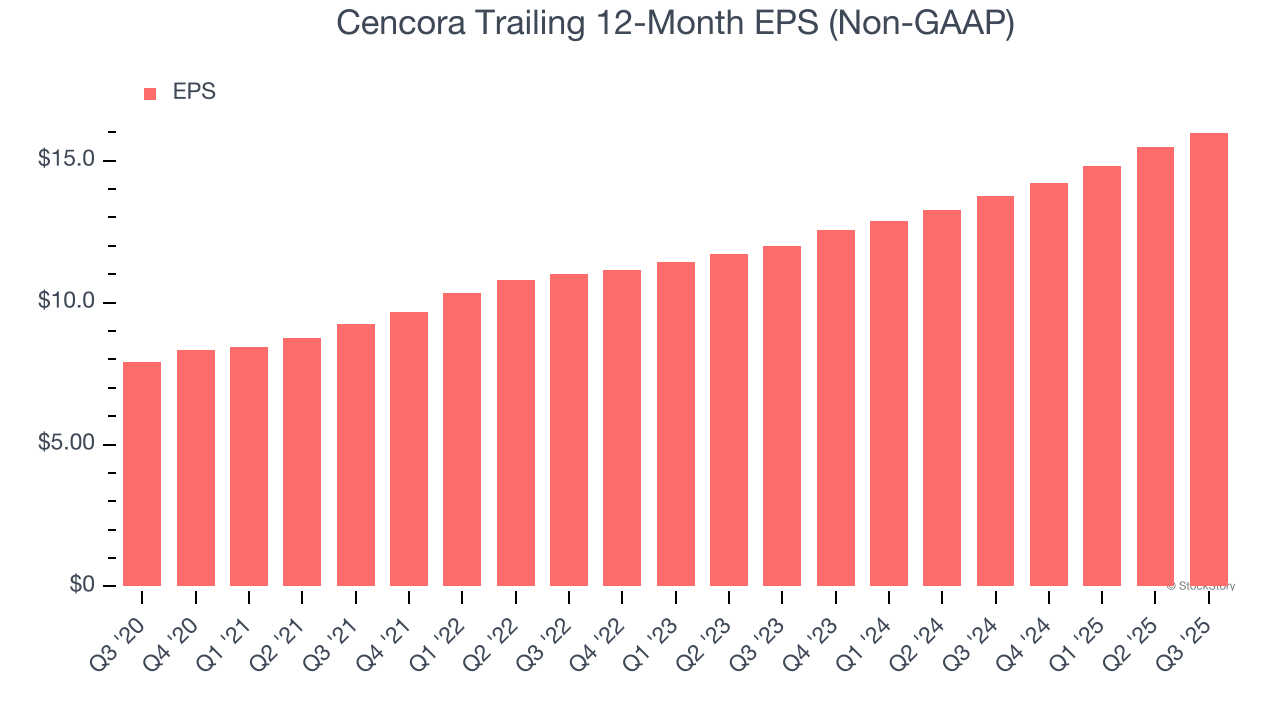
Diving into the nuances of Cencora’s earnings can give us a better understanding of its performance. A five-year view shows that Cencora has repurchased its stock, shrinking its share count by 5%. This tells us its EPS outperformed its revenue not because of increased operational efficiency but financial engineering, as buybacks boost per share earnings. 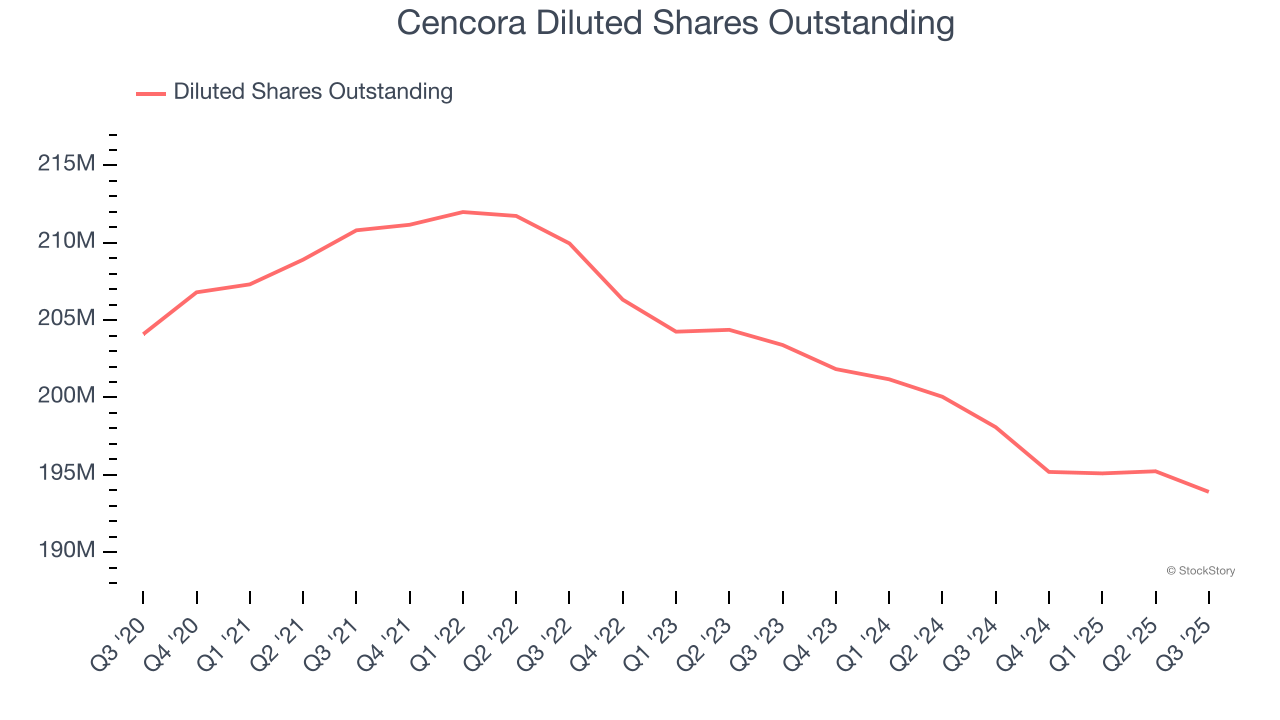
In Q3, Cencora reported adjusted EPS of $3.84, up from $3.34 in the same quarter last year. This print beat analysts’ estimates by 1.4%. Over the next 12 months, Wall Street expects Cencora’s full-year EPS of $15.99 to grow 9.3%.
Key Takeaways from Cencora’s Q3 Results
It was good to see Cencora narrowly top analysts’ full-year EPS guidance expectations this quarter. We were also happy its revenue narrowly outperformed Wall Street’s estimates. Overall, this print had some key positives. The market seemed to be hoping for more, and the stock traded down 1.9% to $338 immediately following the results.
So do we think Cencora is an attractive buy at the current price? If you’re making that decision, you should consider the bigger picture of valuation, business qualities, as well as the latest earnings. We cover that in our actionable full research report which you can read here, it’s free for active Edge members.


