

Medical device company ICU Medical (NASDAQ: ICUI) reported Q3 CY2025 results beating Wall Street’s revenue expectations, but sales fell by 8.9% year on year to $537 million. Its non-GAAP profit of $2.03 per share was 41.6% above analysts’ consensus estimates.
Is now the time to buy ICU Medical? Find out by accessing our full research report, it’s free for active Edge members.
ICU Medical (ICUI) Q3 CY2025 Highlights:
- Revenue: $537 million vs analyst estimates of $512.2 million (8.9% year-on-year decline, 4.8% beat)
- Adjusted EPS: $2.03 vs analyst estimates of $1.43 (41.6% beat)
- Adjusted EBITDA: $105.9 million vs analyst estimates of $87.86 million (19.7% margin, 20.5% beat)
- Adjusted EPS guidance for the full year is $7.50 at the midpoint, beating analyst estimates by 7.3%
- EBITDA guidance for the full year is $400 million at the midpoint, above analyst estimates of $384.8 million
- Operating Margin: 2.6%, down from 3.6% in the same quarter last year
- Free Cash Flow Margin: 5.1%, up from 2.7% in the same quarter last year
- Market Capitalization: $3.14 billion
Vivek Jain, ICU Medical’s Chief Executive Officer, said, “We are pleased with our third quarter results."
Company Overview
Founded in 1984 and named for its initial focus on intensive care units, ICU Medical (NASDAQ: ICUI) develops and manufactures medical products for infusion therapy, vascular access, and vital care applications used in hospitals and other healthcare settings.
Revenue Growth
A company’s long-term sales performance can indicate its overall quality. Any business can experience short-term success, but top-performing ones enjoy sustained growth for years. Over the last five years, ICU Medical grew its sales at a solid 12.9% compounded annual growth rate. Its growth beat the average healthcare company and shows its offerings resonate with customers.
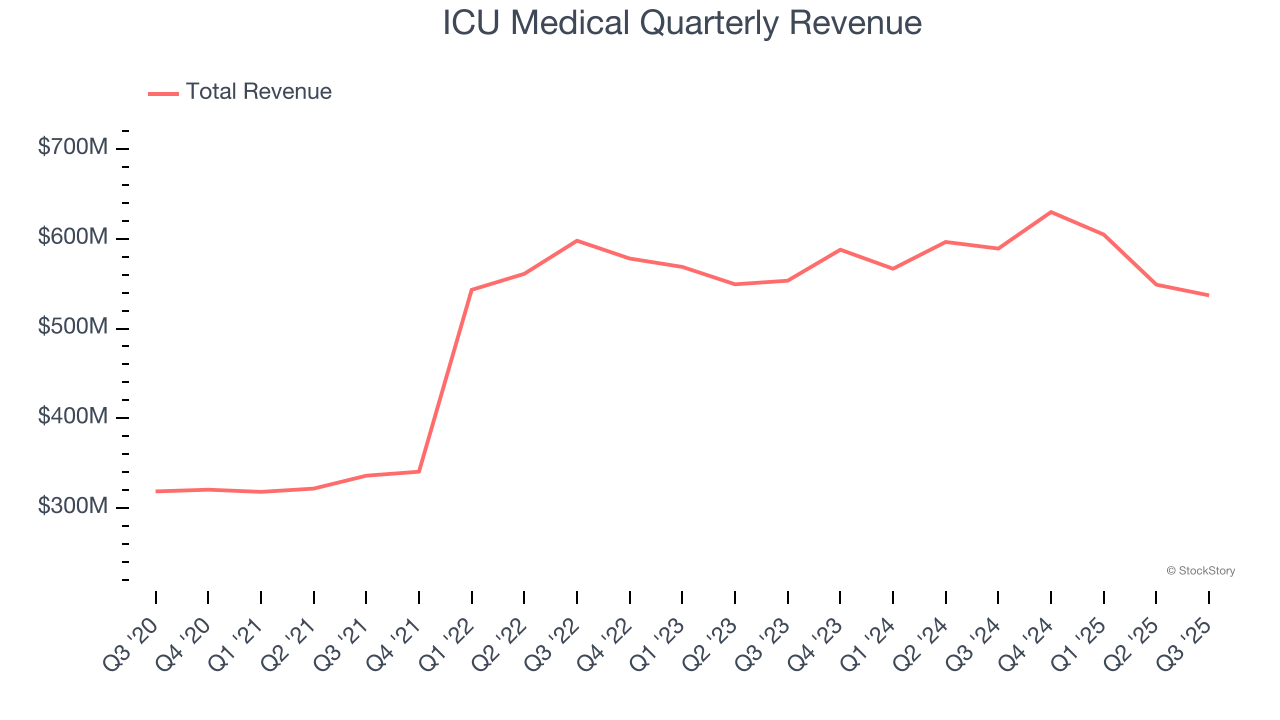
Long-term growth is the most important, but within healthcare, a half-decade historical view may miss new innovations or demand cycles. ICU Medical’s recent performance shows its demand has slowed as its annualized revenue growth of 1.6% over the last two years was below its five-year trend. 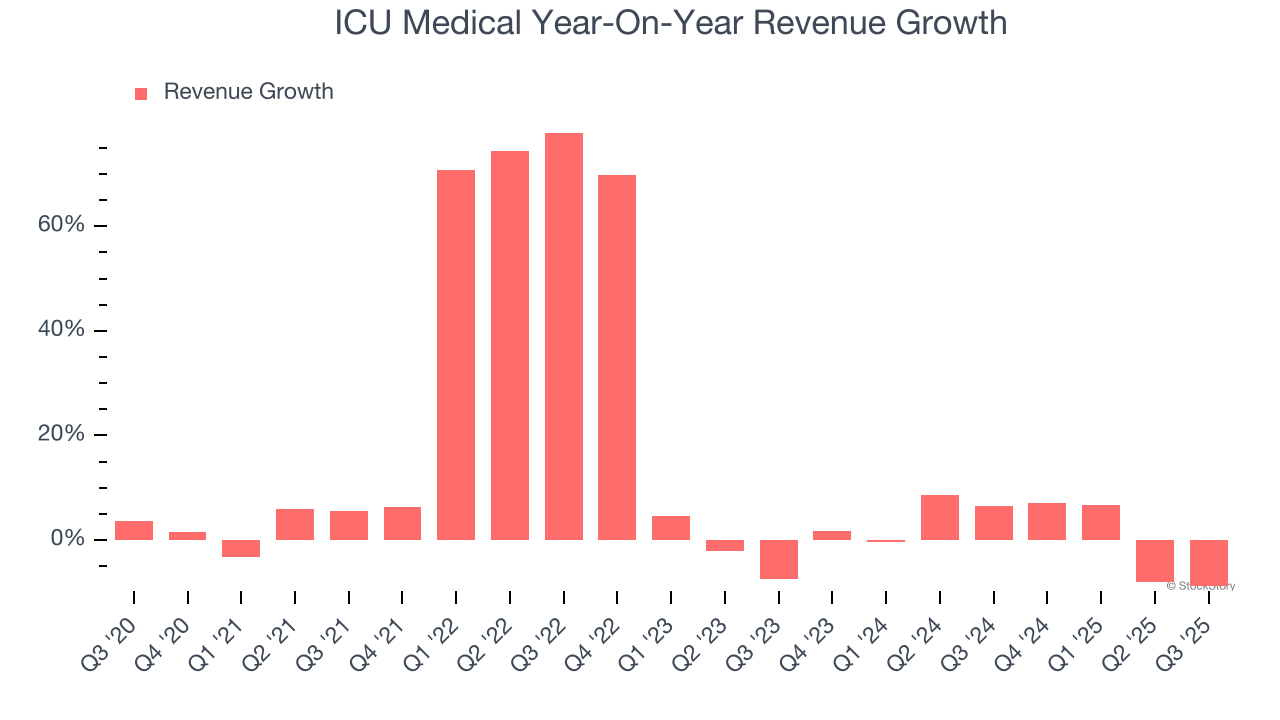
This quarter, ICU Medical’s revenue fell by 8.9% year on year to $537 million but beat Wall Street’s estimates by 4.8%.
Looking ahead, sell-side analysts expect revenue to decline by 7.8% over the next 12 months, a deceleration versus the last two years. This projection doesn't excite us and suggests its products and services will face some demand challenges.
While Wall Street chases Nvidia at all-time highs, an under-the-radar semiconductor supplier is dominating a critical AI component these giants can’t build without. Click here to access our free report one of our favorites growth stories.
Operating Margin
Operating margin is one of the best measures of profitability because it tells us how much money a company takes home after subtracting all core expenses, like marketing and R&D.
ICU Medical was profitable over the last five years but held back by its large cost base. Its average operating margin of 3% was weak for a healthcare business.
Analyzing the trend in its profitability, ICU Medical’s operating margin decreased by 4.7 percentage points over the last five years, but it rose by 3.5 percentage points on a two-year basis. Still, shareholders will want to see ICU Medical become more profitable in the future.
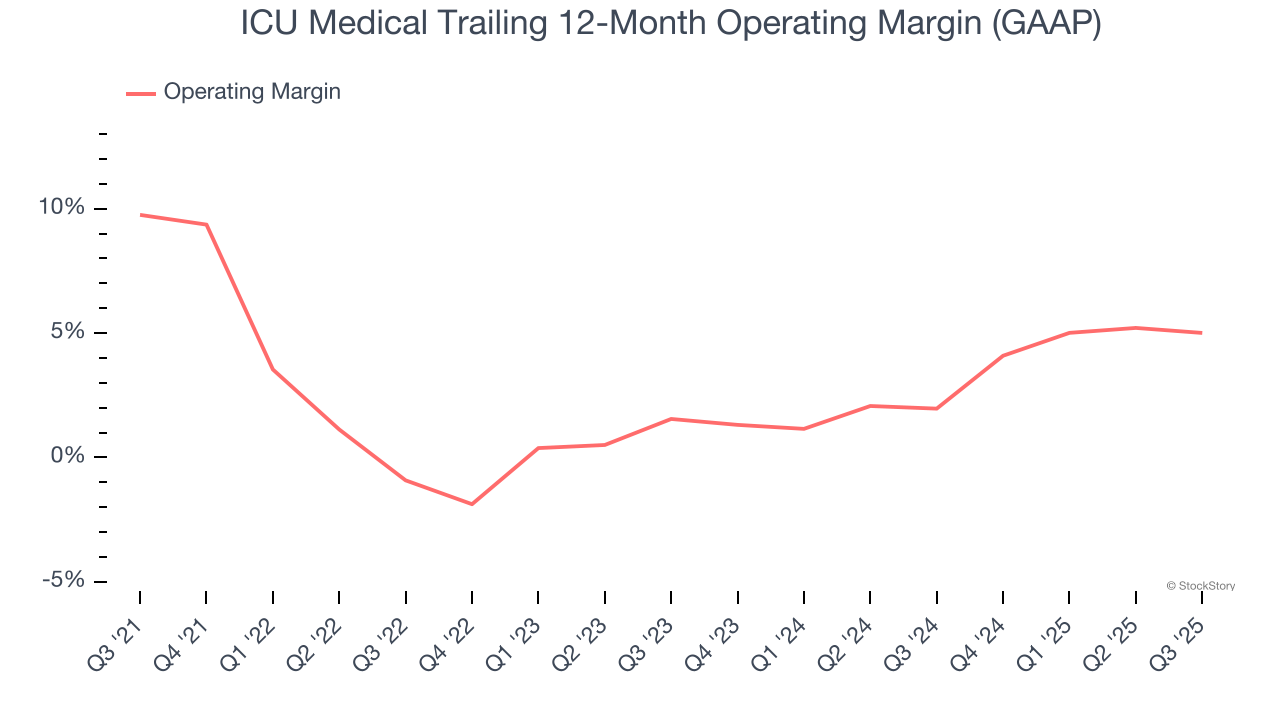
This quarter, ICU Medical generated an operating margin profit margin of 2.6%, down 1 percentage points year on year. This reduction is quite minuscule and indicates the company’s overall cost structure has been relatively stable.
Earnings Per Share
Revenue trends explain a company’s historical growth, but the long-term change in earnings per share (EPS) points to the profitability of that growth – for example, a company could inflate its sales through excessive spending on advertising and promotions.
ICU Medical’s EPS grew at an unimpressive 1.7% compounded annual growth rate over the last five years, lower than its 12.9% annualized revenue growth. This tells us the company became less profitable on a per-share basis as it expanded.
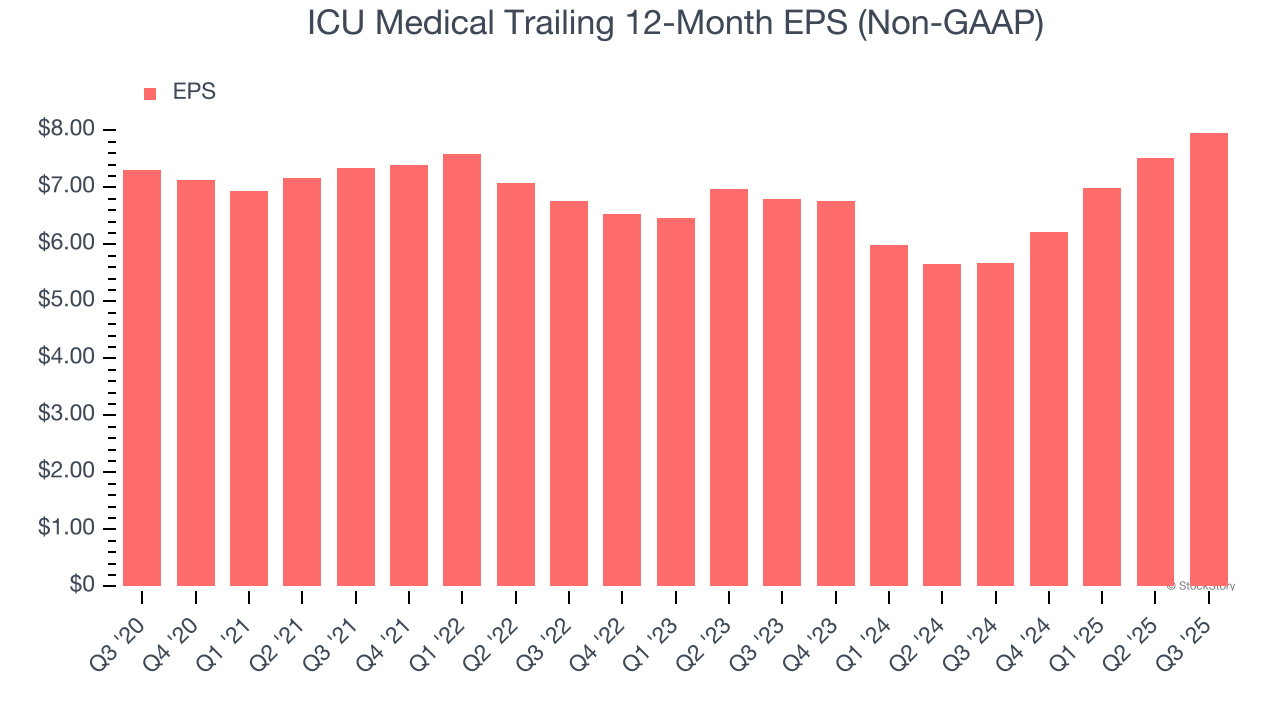
We can take a deeper look into ICU Medical’s earnings to better understand the drivers of its performance. As we mentioned earlier, ICU Medical’s operating margin declined by 4.7 percentage points over the last five years. Its share count also grew by 14.5%, meaning the company not only became less efficient with its operating expenses but also diluted its shareholders. 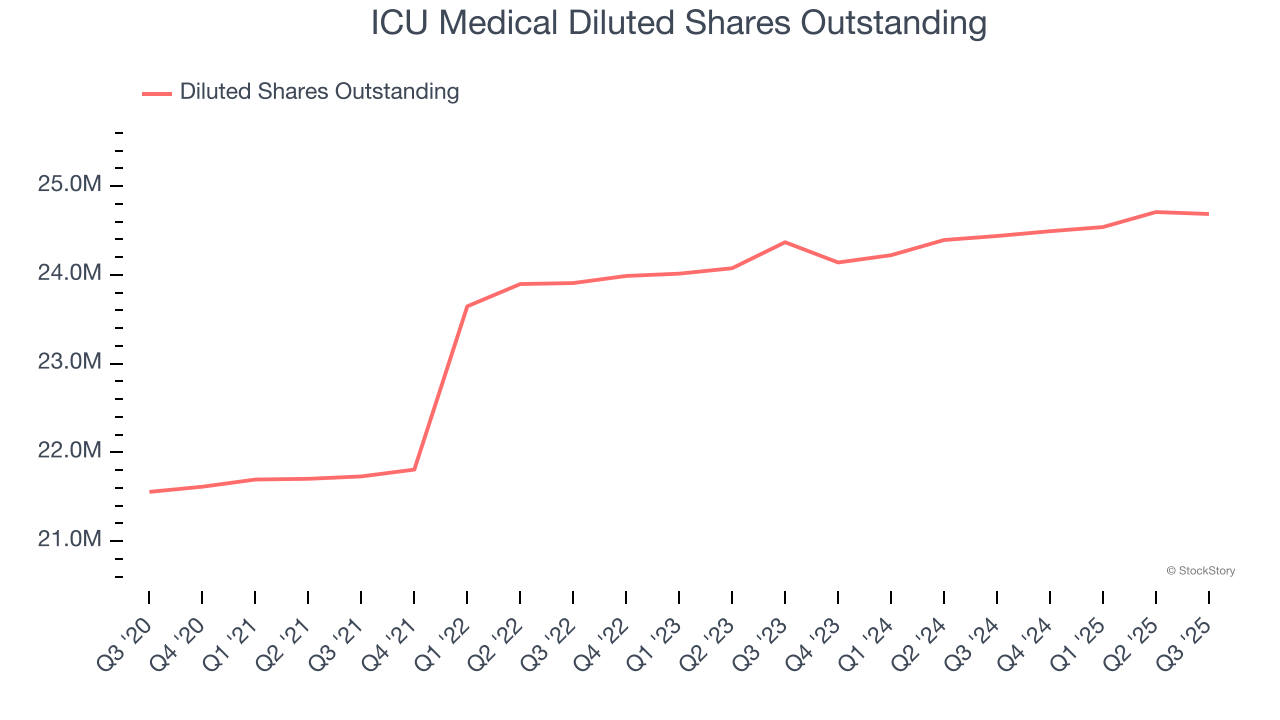
In Q3, ICU Medical reported adjusted EPS of $2.03, up from $1.59 in the same quarter last year. This print easily cleared analysts’ estimates, and shareholders should be content with the results. Over the next 12 months, Wall Street expects ICU Medical’s full-year EPS of $7.96 to shrink by 6.2%.
Key Takeaways from ICU Medical’s Q3 Results
It was good to see ICU Medical beat analysts’ EPS expectations this quarter. We were also excited its full-year EPS guidance outperformed Wall Street’s estimates by a wide margin. Zooming out, we think this was a good print with some key areas of upside. The stock remained flat at $129.67 immediately after reporting.
Is ICU Medical an attractive investment opportunity at the current price? What happened in the latest quarter matters, but not as much as longer-term business quality and valuation, when deciding whether to invest in this stock. We cover that in our actionable full research report which you can read here, it’s free for active Edge members.


