
Aerospace and defense company General Dynamics (NYSE: GD) reported Q1 CY2025 results beating Wall Street’s revenue expectations, with sales up 13.9% year on year to $12.22 billion. Its GAAP profit of $3.66 per share was 5.7% above analysts’ consensus estimates.
Is now the time to buy General Dynamics? Find out by accessing our full research report, it’s free.
General Dynamics (GD) Q1 CY2025 Highlights:
- Revenue: $12.22 billion vs analyst estimates of $12 billion (13.9% year-on-year growth, 1.8% beat)
- EPS (GAAP): $3.66 vs analyst estimates of $3.46 (5.7% beat)
- Adjusted EBITDA: $1.43 billion vs analyst estimates of $1.45 billion (11.7% margin, 1.5% miss)
- Operating Margin: 10.4%, in line with the same quarter last year
- Free Cash Flow was -$290 million compared to -$437 million in the same quarter last year
- Backlog: $88.7 billion at quarter end, down 5.4% year on year
- Market Capitalization: $73.64 billion
"We continue to see steady growth and improvement in operating performance across the defense portfolio," said Phebe Novakovic, chairman and chief executive officer "The Aerospace segment saw a significant increase in profitability, reflecting the manufacturing efficiencies associated with reaching higher levels of production on our new aircraft models."
Company Overview
Creator of the famous M1 Abrahms tank, General Dynamics (NYSE: GD) develops aerospace, marine systems, combat systems, and information technology products.
Defense Contractors
Defense contractors typically require technical expertise and government clearance. Companies in this sector can also enjoy long-term contracts with government bodies, leading to more predictable revenues. Combined, these factors create high barriers to entry and can lead to limited competition. Lately, geopolitical tensions–whether it be Russia’s invasion of Ukraine or China’s aggression towards Taiwan–highlight the need for defense spending. On the other hand, demand for these products can ebb and flow with defense budgets and even who is president, as different administrations can have vastly different ideas of how to allocate federal funds.
Sales Growth
A company’s long-term performance is an indicator of its overall quality. Any business can experience short-term success, but top-performing ones enjoy sustained growth for years. Regrettably, General Dynamics’s sales grew at a tepid 4.8% compounded annual growth rate over the last five years. This was below our standard for the industrials sector and is a tough starting point for our analysis.
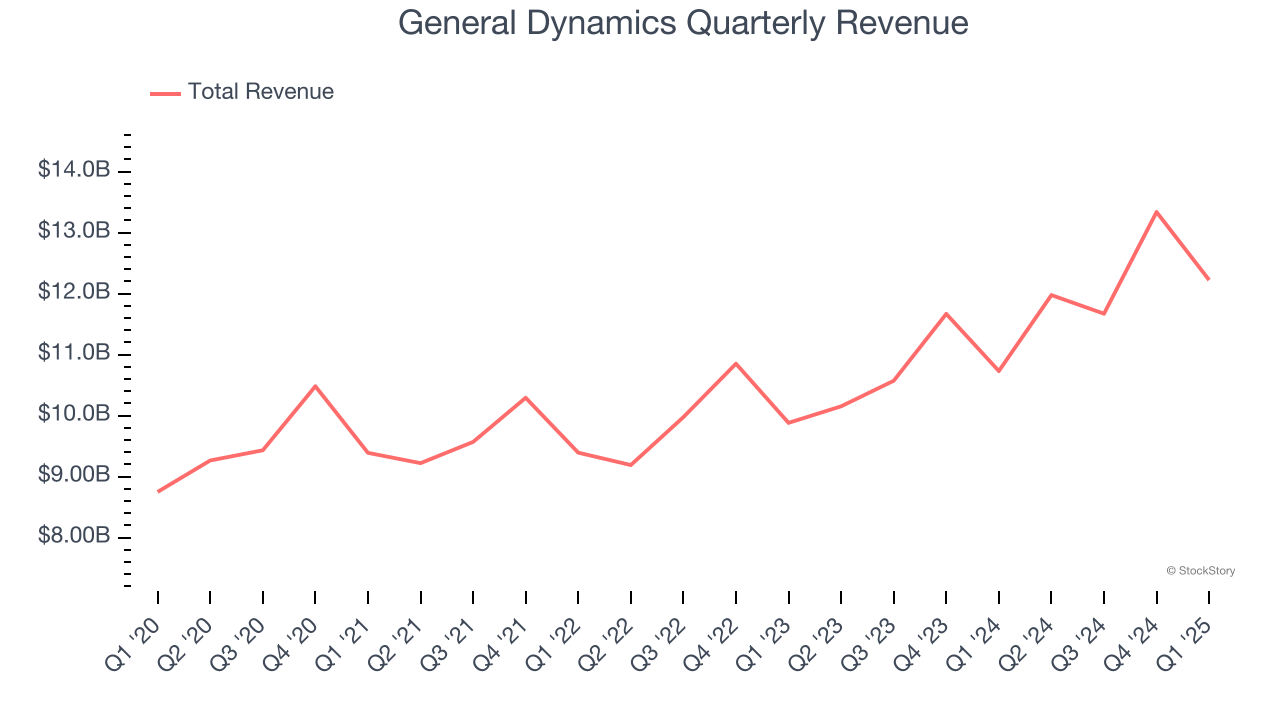
Long-term growth is the most important, but within industrials, a half-decade historical view may miss new industry trends or demand cycles. General Dynamics’s annualized revenue growth of 11.1% over the last two years is above its five-year trend, suggesting its demand recently accelerated. 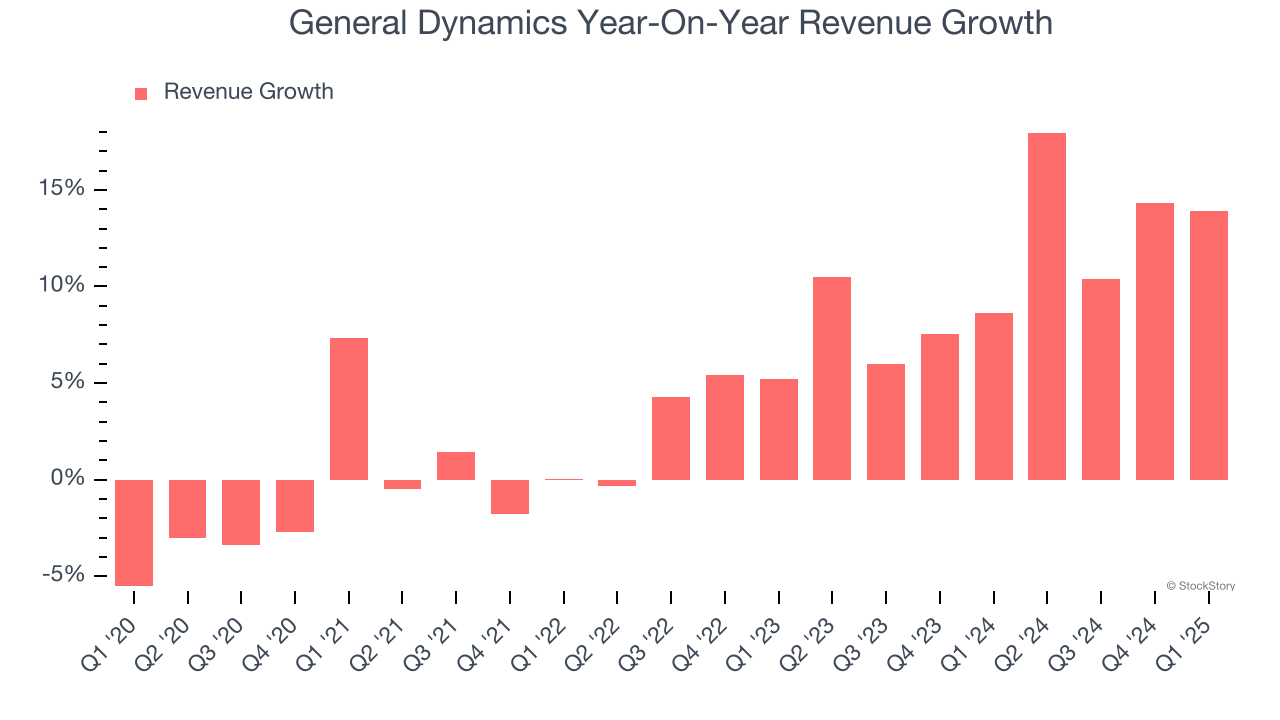
We can better understand the company’s revenue dynamics by analyzing its backlog, or the value of its outstanding orders that have not yet been executed or delivered. General Dynamics’s backlog reached $88.7 billion in the latest quarter and was flat over the last two years. Because this number is lower than its revenue growth, we can see the company fulfilled orders at a faster rate than it added new orders to the backlog. This implies General Dynamics was operating efficiently but raises questions about the health of its sales pipeline. 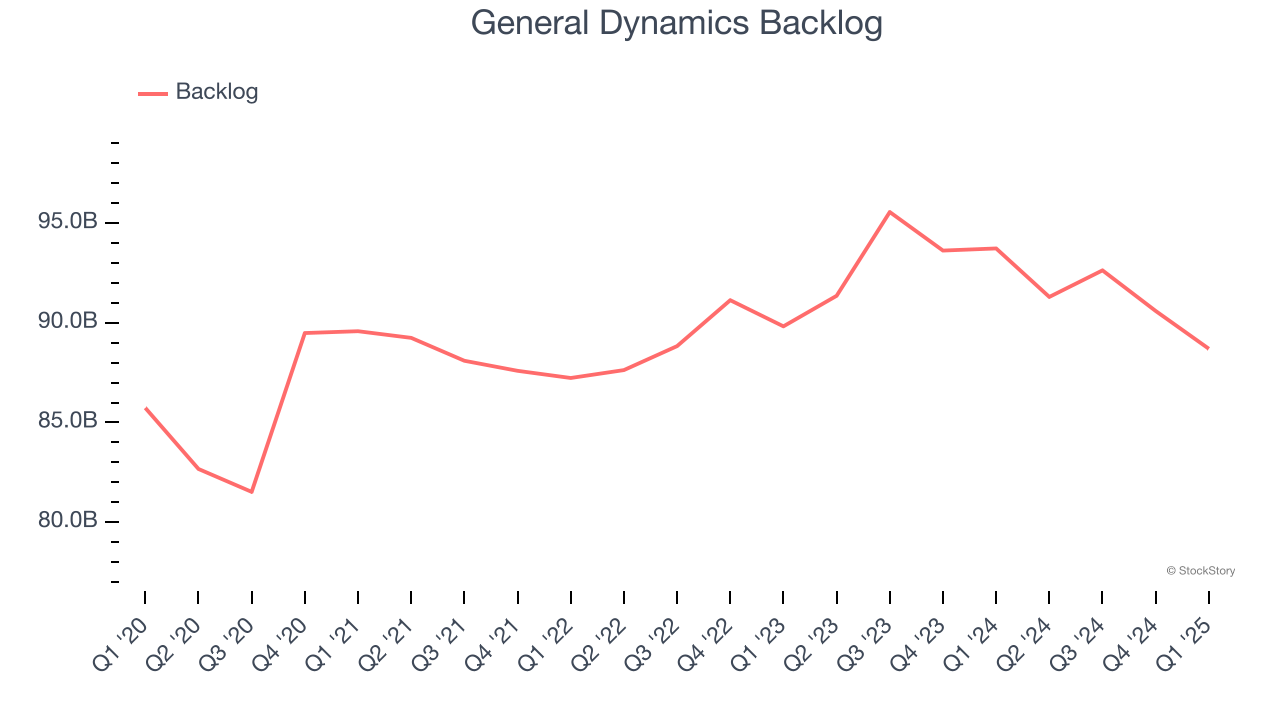
This quarter, General Dynamics reported year-on-year revenue growth of 13.9%, and its $12.22 billion of revenue exceeded Wall Street’s estimates by 1.8%.
Looking ahead, sell-side analysts expect revenue to grow 3% over the next 12 months, a deceleration versus the last two years. This projection is underwhelming and suggests its products and services will see some demand headwinds.
Unless you’ve been living under a rock, it should be obvious by now that generative AI is going to have a huge impact on how large corporations do business. While Nvidia and AMD are trading close to all-time highs, we prefer a lesser-known (but still profitable) stock benefiting from the rise of AI. Click here to access our free report one of our favorites growth stories.
Operating Margin
General Dynamics has managed its cost base well over the last five years. It demonstrated solid profitability for an industrials business, producing an average operating margin of 10.5%.
Analyzing the trend in its profitability, General Dynamics’s operating margin might fluctuated slightly but has generally stayed the same over the last five years. This raises questions about the company’s expense base because its revenue growth should have given it leverage on its fixed costs, resulting in better economies of scale and profitability.
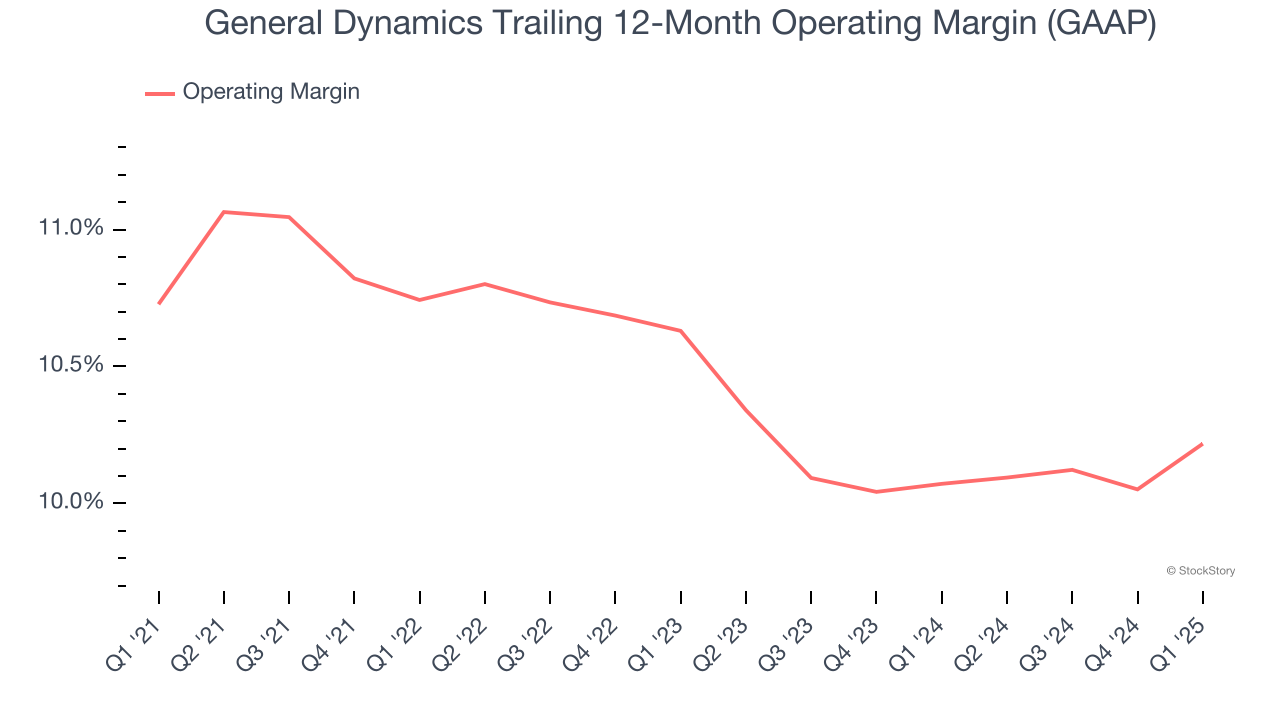
In Q1, General Dynamics generated an operating profit margin of 10.4%, in line with the same quarter last year. This indicates the company’s overall cost structure has been relatively stable.
Earnings Per Share
Revenue trends explain a company’s historical growth, but the long-term change in earnings per share (EPS) points to the profitability of that growth – for example, a company could inflate its sales through excessive spending on advertising and promotions.
General Dynamics’s weak 4% annual EPS growth over the last five years aligns with its revenue performance. This tells us it maintained its per-share profitability as it expanded.
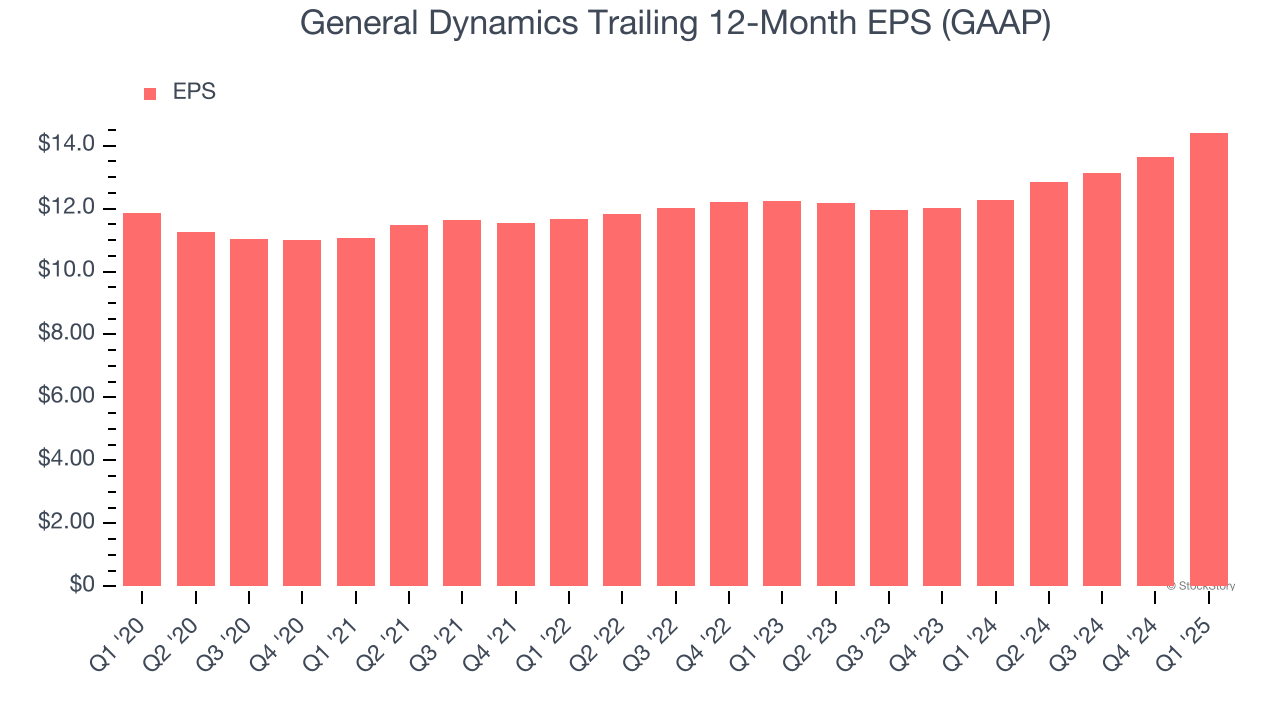
Like with revenue, we analyze EPS over a shorter period to see if we are missing a change in the business.
For General Dynamics, its two-year annual EPS growth of 8.6% was higher than its five-year trend. Accelerating earnings growth is almost always an encouraging data point.
In Q1, General Dynamics reported EPS at $3.66, up from $2.88 in the same quarter last year. This print beat analysts’ estimates by 5.7%. Over the next 12 months, Wall Street expects General Dynamics’s full-year EPS of $14.41 to grow 4.2%.
Key Takeaways from General Dynamics’s Q1 Results
We enjoyed seeing General Dynamics beat analysts’ revenue expectations this quarter. We were also happy its EPS outperformed Wall Street’s estimates. On the other hand, its backlog missed significantly and its EBITDA fell slightly short of Wall Street’s estimates. Overall, this quarter was mixed. The stock remained flat at $274.12 immediately following the results.
General Dynamics didn’t show it’s best hand this quarter, but does that create an opportunity to buy the stock right now? When making that decision, it’s important to consider its valuation, business qualities, as well as what has happened in the latest quarter. We cover that in our actionable full research report which you can read here, it’s free.


