Airbnb, Inc.'s (ABNB) Q3 results, released on Nov. 6, showed +9.7% YoY revenue growth and 11.5% free cash flow (FCF) growth. Moreover, its FCF margin was strong at over 38% on a trailing 12-month basis. That makes ABNB stock look undervalued by 15% to 20%.
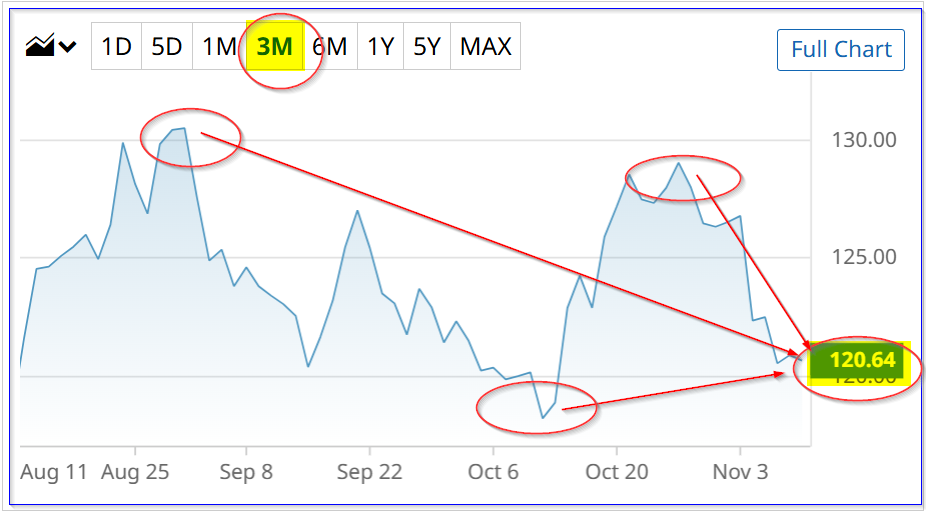
ABNB is at $120.97 on Monday, Nov. 10, well off a recent peak of $129.07 on Oct. 27 and a prior peak of $130.53 on Aug. 29.
It could be worth up to $146 in the next year, as this article will show. That is based on its strong FCF margins and an average FCF yield metric.
Strong FCF Margins and FCF Forecast
People still love renting places with Airbnb, as all its key performance indicators (KPIs) show for Q3, including Gross Booking Value up 14% YoY. As a result, revenue was up almost 10% YoY (+9.7%) to over $4 billion for the first time (i.e., $4,095 million).
Moreover, on a trailing 12-month basis (TTM), its TTM revenue was almost $12 billion ($11.943 billion), up 3.13% from the prior quarter. That puts it on a run-rate of 12.5% growth if this keeps up. That will be important in estimating future growth.
Most importantly, Airbnb continued to generate strong positive free cash flow (FCF). It hit $1.349 billion in the quarter and $4.55 billion on a TTM basis.
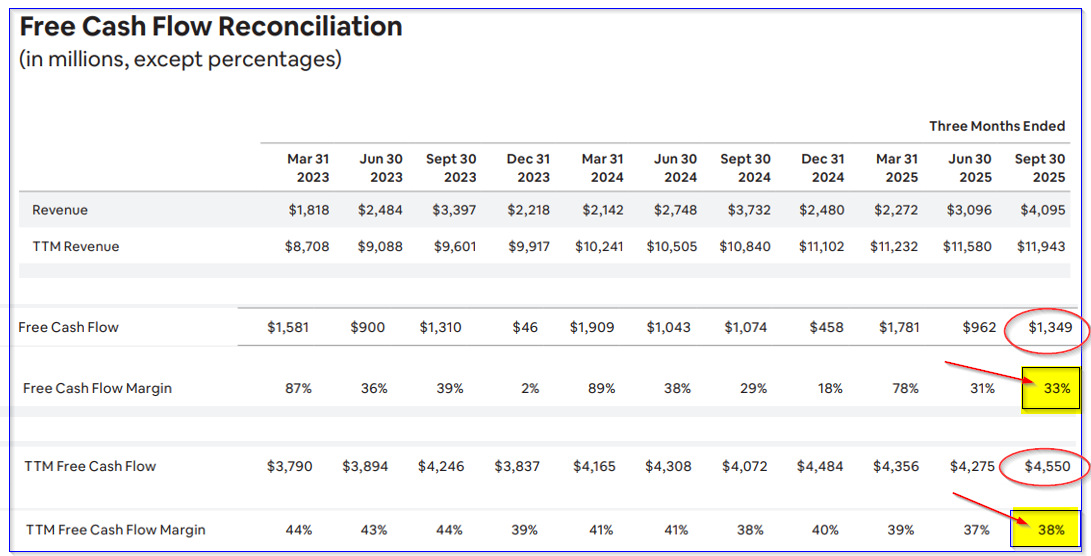
That represents 32.9% of quarterly revenue and 38.1% of TTM revenue, respectively. Airbnb is one of the few companies that publishes its FCF margins, as shown on page 27 of its quarterly shareholder letter.
Note that it has had higher margins in the past, but its TTM margins have stayed stable in a range between 39% and 41% over the prior year. This is because Q1 always shows significantly higher quarterly margins as people plan and pay for their summer vacations. As a result, we can rely on its TTM figure to project FCF going forward.
For example, management provided an outlook for Q4 and analysts now project $12.16 billion for 2025. But the market always looks forward when setting a value for a stock. We can use the analysts' 2027 revenue forecast of $13.32 billion to project FCF next year.
Target Price for ABNB Stock
For example, multiplying its latest TTM FCF margin of 38.1% by $13.32 billion provides a 2027 FCF forecast of over $5 billion:
0.381 x $13.32 billion 2027 revenue = $5.075 billion FCF
That is +11.5% higher than its Q3 TTM FCF of $4.55 billion.
Moreover, assuming the market gives the stock a 6.0% FCF yield (i.e., the dividend yield would be 6% if 100% of FCF is paid out to shareholders as a dividend):
$5.075 b FCF/ 0.06 = $84.58 billion market value
That is 15.3% higher than its present market cap of $73.368 billion, according to Yahoo! Finance.
Moreover, Morningstar reports that its average 5-year price/cash flow multiple has been 26.81x. That is the same as a CF yield of 3.73% (i.e., 1/26.81 = 0.03729).
So, just to be conservative, let's use a 5.5% FCF yield metric:
$5.075b FCF / 0.055 = $92.27 billion mkt value
That is 25.76% higher than its present stock market value of $72.368 billion.
In other words, ABNB stock is worth between 15.3% and 25.76% more, or +20.5% upside on average.
That puts the target price at $146 per share:
1.205 x $120.97 price today = $145.77 target
One way to play this is to set a lower buy-in by selling short out-of-the-money (OTM) puts. That way, an investor can get paid while waiting for ABNB stock to fall a bit.
Shorting OTM ABNB Puts
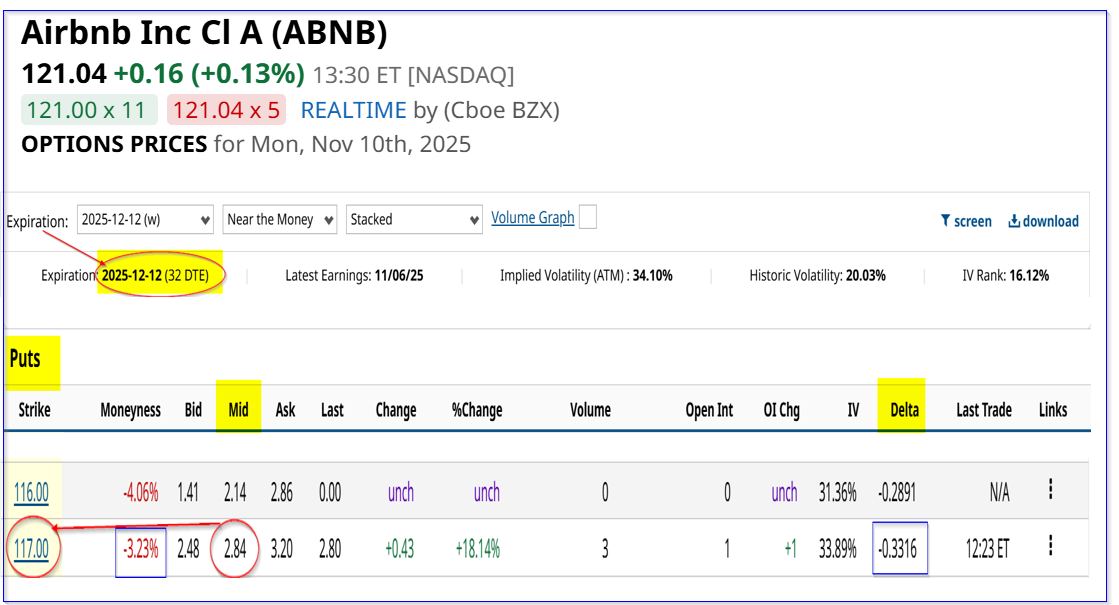
For example, the Dec. 12 expiry put option chain shows that the $117.00 strike price put contract has a midpoint premium of $2.84. This strike price is 3.3% below today's price of $121 per share, providing some downside protection to a potential buyer who shorts these puts.
In return, the investor receives $284 for the $11,700 in secured cash or collateral to do this trade. That represents a one-month yield of 2.2427% to the short-seller of these puts.
The point is that this is a good way to set a potentially lower buy-in point. In fact, the breakeven price, after accounting for the $2.84 income already received, is:
$117 - $2.84 = $114.16, or almost $7 below today's price, i.e., -5.65% downside protection
The point is that this is a potential lower buy-in point for potential ABNB investors. Moreover, even if the stock does not fall to $117.00 over the next month, the investor gets to keep the $284 per contract shorted.
That means they can do the same trade again in a month. So, the expected return, if repeated over 6 months, is almost +13.5%:
2.2427% x 6 = 13.4562%
That is the same as holding ABNB shares and seeing them rise to $137.28 per share. Note, this assumes that the investor can make over 2.24% in short-put yield each month for 6 months, which may not be possible. But at any point, the investor may be able to invest in ABNB at a lower price if the account is assigned to buy shares at an out-of-the-money (OTM) price.
The bottom line is that ABNB stock looks between 15% and 20% undervalued here. One profitable way to play it is to short OTM puts on a repeated one-month basis.
On the date of publication, Mark R. Hake, CFA did not have (either directly or indirectly) positions in any of the securities mentioned in this article. All information and data in this article is solely for informational purposes. For more information please view the Barchart Disclosure Policy here.
More news from Barchart
- Airbnb Keeps Generating Strong FCF and FCF Margins and Could Be 15% -20% Too Cheap
- Despite an Earnings Miss, Super Micro Computer’s (SMCI) Options Flow Points to a Potential Reversal
- Global Sugar Supply Peaks Near Mid-October: SB Drops 14/15 Years. Are You Trading the Macro or the Noise?
- Option Volatility and Earnings Report for November 10 - 14


