
In most circumstances, losing 25% of market value over a one-week period represents cause for concern. That’s basically the situation Super Micro Computer (SMCI) finds itself in following a rough earnings miss. However, the options market appears to be broadcasting an optimistic tune. Combined with an intriguing quantitative signal, it may be time to take a closer look at SMCI stock.
Last week, Super Micro tumbled badly after the artificial-intelligence server specialist missed Wall Street analysts’ consensus targets on both the top and bottom lines in the company’s fiscal first quarter. Making matters worse, the tech giant reported its lowest-ever gross margin at 9.3%. Based on the current financial picture, the margin might not improve in the near term, placing SMCI stock under a cloud of skepticism.
Unsurprisingly, investors heavily penalized the security. Over the trailing month, SMCI stock tumbled more than 32%. To be fair, on a year-to-date basis, Super Micro is firmly in positive territory, up over 30%. But given the extreme volatility, many are undoubtedly eyeballing the “sell” button.
Still, what’s fascinating are the transactions that have taken place in the options market. Specifically, options flow — which focuses exclusively on big block transactions likely placed by institutional investors — shows steady inflows throughout last week. Indeed, the data speaks for itself.
- On Nov. 3, net trade sentiment stood at $1.48 million.
- On Nov. 4, net trade sentiment clocked in at $505,200.
- On Nov. 5, net trade sentiment soared to $8.34 million.
- On Nov. 6, net trade sentiment was $697,800.
- On Nov. 7, net trade sentiment reached $986,800.
In terms of dollar volume, the biggest trades were for debit-based call options. To be sure, no one can absolutely identify intent behind these derivative transactions. However, in order for a debit trade to make sense, the event that is being wagered on must materialize — and in a great enough magnitude to exceed the premium paid.
By logical deduction, the smart money does seem unusually bullish on SMCI stock.
Quant Picture for SMCI Stock is Even More Enticing for Speculators
One of the fascinating aspects of the recently concluded World Series matchup between the Los Angeles Dodgers and Toronto Blue Jays was the its probabilistic intensity. There were a few key moments where, had the Jays had circumstances tilt a fraction or a millimeter, they could have walked away as victors. Unfortunately for them, the baseball gods crafted a different narrative.
Still, the overriding point that I took away was that the contest represented a broad spectrum of possibilities. However, as the game went on, those possible pathways began collapsing until there was only one observable reality remaining, resulting in the Dodgers going back-to-back.
Similarly, the market might not follow one deterministic path but may represent multiple possibilities. As time and circumstances tick by, these possible pathways collapse until there is one observable reality remaining. That’s part of what makes quantitative analysis so exciting. Yes, we’re quantifying our decision-tree logic but we’re also taking lessons from quantum mechanics.
In other words, our goal as quants is to determine which version of reality — among all possible realities — will ultimately win out. If we can calculate these odds, we would effectively enjoy an informational arbitrage.
Using Russian axioms (Kolmogorov, Markov) on a dataset extending back to January 2019, the forward 10-week median returns of SMCI stock would be expected to form a distributional curve, with prices ranging from $38.40 and $43.90 (assuming an anchor price of $39.76, Friday’s close). Further, price clustering would likely be predominant at $41.40.
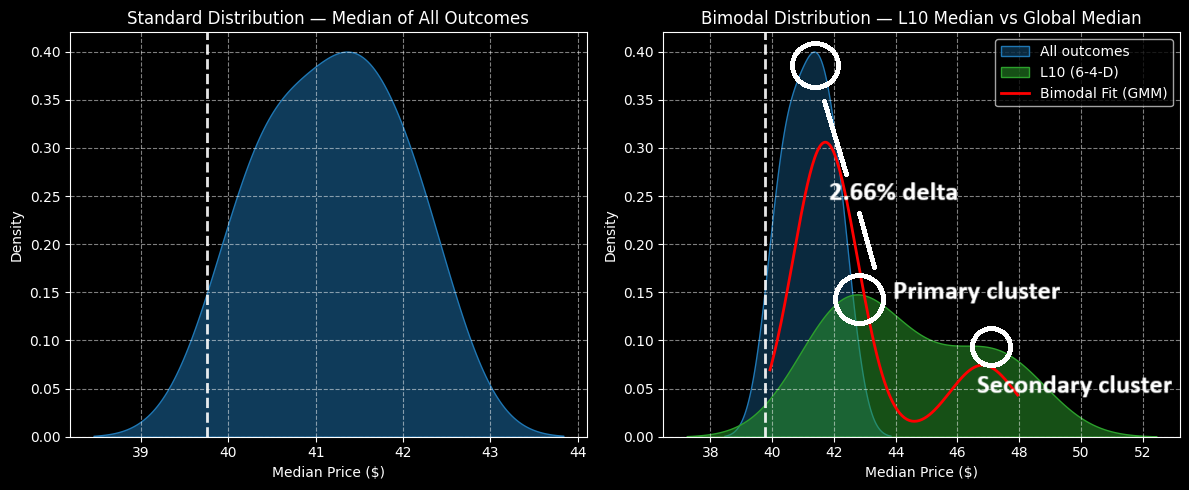
However, SMCI stock is not in a homeostatic or baseline state but rather is arranged in an unusual 6-4-D formation; that is, in the past 10 weeks, SMCI printed six up weeks and four down weeks, but with an overall downward slope. Under this unusual sequence, the forward 10-week median outcomes would be expected to range between $37 and $53.
Most importantly, primary price clustering would likely occur at $42.50, with secondary clustering potentially occurring at $47. Taking the more conservative comparison, there’s a 2.66% positive delta in density dynamics that bullish options traders can potentially exploit.
Applying Data Science to Find an Ideal Trade
Based on the market intelligence above, arguably the most tempting idea to consider is the 41/43 bull call spread expiring Dec. 19. This transaction involves buying the $41 call and simultaneously selling the $43 call, for a net debit paid of $86 (the most that can be lost in the trade).
Should SMCI stock rise through the second-leg strike ($43) at expiration, the maximum profit is $114, a payout of roughly 133%. Most notably, the breakeven price is $41.86, which is contextually a realistic target. Again, under 6-4-D conditions, primary clustering would occur at $42.50, which is nearly 1.53% higher than breakeven.
More aggressive traders can push for bull spreads with a higher second-leg strike, such as $45. In such cases, the max payout is almost 190%. However, the 41/43 spread is more conservative and therefore realistic, as it’s essentially bidding for the primary cluster.
Either way, with data analytics, you can make much smarter and more informed decisions in your trading endeavors.
On the date of publication, Josh Enomoto did not have (either directly or indirectly) positions in any of the securities mentioned in this article. All information and data in this article is solely for informational purposes. For more information please view the Barchart Disclosure Policy here.
More news from Barchart
- Analysts Say Nvidia Stock Is ‘Dominant’ Amid a Giant Race to ‘Secure Compute.’ Buy Shares Now?
- Cathie Wood Is Buying the Dip in Archer Aviation Stock. Should You?
- 30,000 Reasons It May Be Time to Sell Amazon Stock Now
- Airbnb Keeps Generating Strong FCF and FCF Margins and Could Be 15% -20% Too Cheap


