• Image 01
  • Image 02
  • Image 03
  • Image 04
  • Image 05
  • Image 06
Need assistance? Contact Us: 1-800-255-5897

Menu

  • Home
  • About Us
    • Company Overview
    • Management Team
    • Board of Directors
  • Your Loan Service Center
  • MAKE A PAYMENT
  • Business Service Center
  • Contact Us
  • Home
  • About Us
    • Company Overview
    • Management Team
    • Board of Directors
  • Your Loan Service Center
  • MAKE A PAYMENT
  • Business Service Center
  • Contact Us
Recent Quotes
View Full List
My Watchlist
Create Watchlist
Indicators
DJI
Nasdaq Composite
SPX
Gold
Crude Oil
Markets
Stocks
ETFs
Tools
Markets:
Overview
News
Currencies
International
Treasuries

Is Exxon Mobil Stock Underperforming the S&P 500?

By: Barchart.com
November 25, 2025 at 08:41 AM EST

With a market cap of $489.1 billion, Exxon Mobil Corporation (XOM) is one of the world’s largest integrated energy companies, with leading upstream oil and gas assets, the largest global refining operations, and substantial chemical businesses. Known for disciplined capital allocation and industry-leading returns, the company maintains a strong dividend record and credit profile. 

Companies valued at $200 billion or more are generally considered “mega-cap” stocks, and Exxon Mobil fits this criterion perfectly. Its operations span traditional energy, petrochemicals, and emerging lower-emission opportunities, positioning it as a bellwether in the sector.

More Top Stocks Daily: Go behind Wall Street’s hottest headlines with Barchart’s Active Investor newsletter.


However, shares of the Spring, Texas-based company have fallen 4.9% from its 52-week high of $121.88. Over the past three months, XOM stock has risen 4.2%, which slightly outpaced the broader S&P 500 Index’s ($SPX) return of 4.1% during the same period.

www.barchart.com

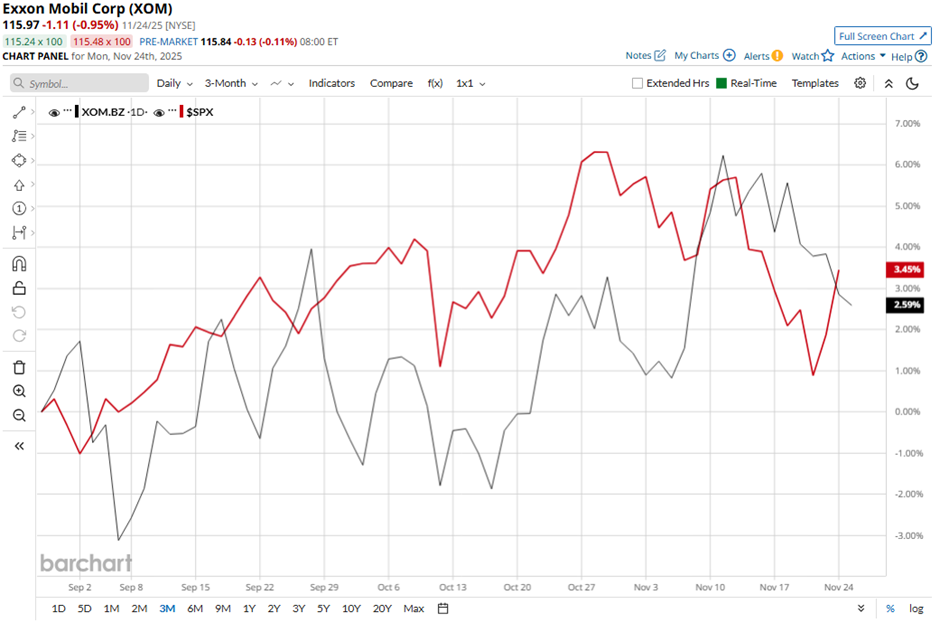
In the longer term, XOM stock has gained 7.8% on a YTD basis, lagging behind the SPX’s 13.5% increase. Moreover, shares of the oil and natural gas company have dipped 4.8% over the past 52 weeks, compared to the 11.2% gain of the SPX over the same time frame.

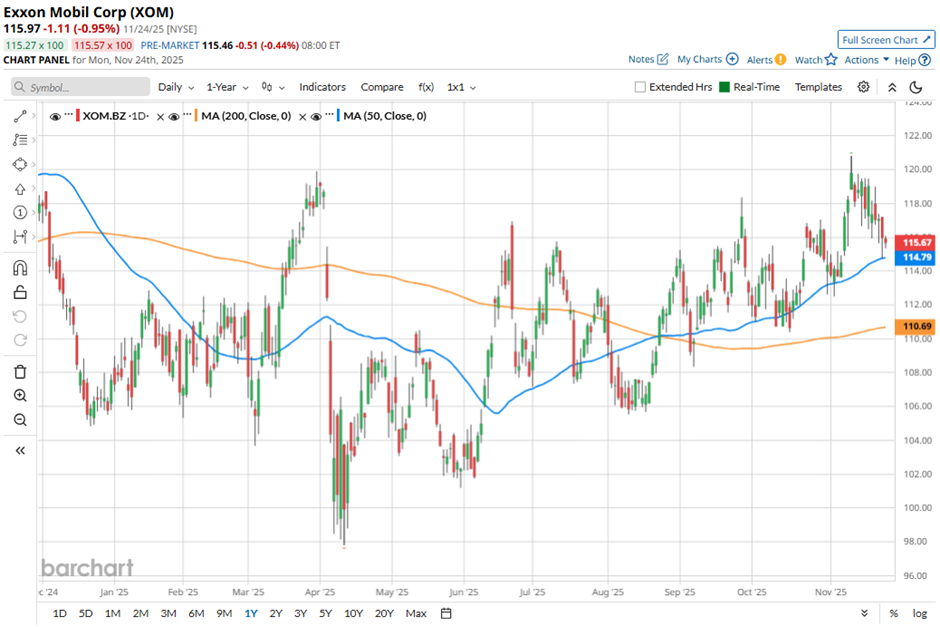
The stock has been trading above its 50-day and 200-day moving averages since late August.

www.barchart.com

Despite reporting better-than-expected Q3 2025 adjusted EPS of $1.88, shares of XOM fell marginally on Oct. 31 as the company reported revenue of $85.29 billion, below forecasts. Investors also focused on weakness in key segments, including a $1.4 billion year-over-year decline in Chemical Products earnings and lower base volumes, which overshadowed the positive production and cash-flow headlines.

In comparison with its rival, Chevron Corporation (CVX) stock has lagged behind XOM stock. CVX stock has soared 3.4% on a YTD basis and declined 7.8% over the past 52 weeks.

Despite the stock’s underperformance relative to the SPX over the past year, analysts are moderately optimistic about its prospects. XOM stock has a consensus rating of “Moderate Buy” from the 26 analysts covering the stock, and the mean price target of $128.96 is a premium of 11.2% to current levels.


On the date of publication, Sohini Mondal did not have (either directly or indirectly) positions in any of the securities mentioned in this article. All information and data in this article is solely for informational purposes. For more information please view the Barchart Disclosure Policy here.


More news from Barchart

  • Alphabet Stock Is on a Tear, But Is Now the Time to Buy GOOGL?
  • Palantir Stock Sinks 22% From Its Peak. Should You Buy, Sell, or Hold PLTR?
  • Micron’s Monster 161% YTD Rally Isn’t a Reason to Sell
  • Wall Street Says SoFi Stock Could Climb 39% In a Year

More News

View More
News headline image
Wall Street’s Sleeping Giant: Is Amazon About to Wake Up? ↗
Today 18:29 EST
Via MarketBeat
Tickers AAPL AMZN GOOGL
News headline image
Checkmate in the Cloud: ServiceNow's Shopping Spree ↗
Today 18:16 EST
Via MarketBeat
Tickers MOVE NOW
News headline image
The Contrarian Case for MSTR Amid MSCI Delisting Debacle ↗
Today 17:46 EST
Via MarketBeat
Tickers MSTR
News headline image
Worried About Mag 7 Concentration Risk? This ETF Could Help ↗
Today 16:16 EST
Via MarketBeat
Topics ETFs
Tickers CAG NVDA ORCL RSP WBD
News headline image
Dell Just Hit a Record in AI Orders—But the Real Test Starts Now ↗
Today 15:03 EST
Via MarketBeat
Topics Artificial Intelligence
Tickers DELL NVDA

Recent Quotes

View More
Symbol Price Change (%)
AMZN  234.42
+0.54 (0.23%)
AAPL  286.19
+3.09 (1.09%)
AMD  215.24
-4.52 (-2.06%)
BAC  53.19
-0.05 (-0.09%)
GOOG  316.02
+0.90 (0.29%)
META  647.10
+6.23 (0.97%)
MSFT  490.00
+3.26 (0.67%)
NVDA  181.46
+1.54 (0.86%)
ORCL  201.10
+0.16 (0.08%)
TSLA  429.24
-0.90 (-0.21%)
FinancialContent
Stock Quote API & Stock News API supplied by www.cloudquote.io
Quotes delayed at least 20 minutes.
By accessing this page, you agree to the Privacy Policy and Terms Of Service.
© 2025 FinancialContent. All rights reserved.

Having difficulty making your payments? We're here to help! Call 1-800-255-5897

Copyright © 2019 Franklin Credit Management Corporation
All Rights Reserved
Contact Us | Privacy Policy | Terms of Use | Sitemap