
CME Group Inc. (CME) is a major force in global finance, a Chicago-based titan that has grown into the world’s preeminent arena for derivatives trading. What began as separate, historic exchanges has evolved into a unified powerhouse, bringing together the Chicago Mercantile Exchange, Chicago Board of Trade, NYMEX, and COMEX under one formidable umbrella.
From interest rates and equities to currencies, energy, agriculture, and precious metals, CME Group serves as the silent engine behind markets that never sleep. Its flagship electronic platform, CME Globex, delivers instant access, sharp price discovery, and industrial-grade risk management to participants across continents, ensuring that capital flows remain steady even when volatility strikes. Its market capitalization stands at around $101.3 billion.
Companies worth $10 billion or more typically earn the “large-cap” badge, and CME clears that bar with ease. That size reflects more than just market value; it reflects decades of building influence, trust, and irreplaceable infrastructure in the global derivatives ecosystem. CME did not stumble into large-cap territory but earned it by becoming the backbone of risk management across interest rates, equity indexes, foreign currencies, and commodities. With exclusive rights to list and clear S&P futures and an unmatched product breadth, CME’s rise into large-cap prestige was driven by necessity as much as success – the global financial system simply runs smoother with CME at the center.
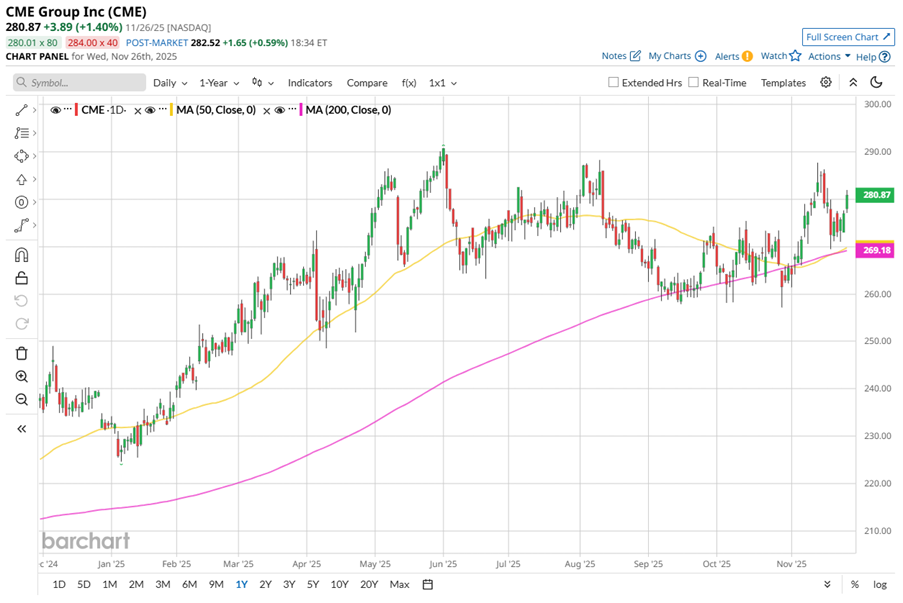
That strength was on display earlier this year when CME stock touched a fresh 52-week high of $290.79 on June 2. While shares currently sit about 3.1% below that peak, the stock’s short-term performance still shows resilience. Over the past three months, CME gained 3.4%, not quite enough to beat the Nasdaq Composite’s ($NASX) 7.8% uptick, but steady enough to show investors are not backing away.
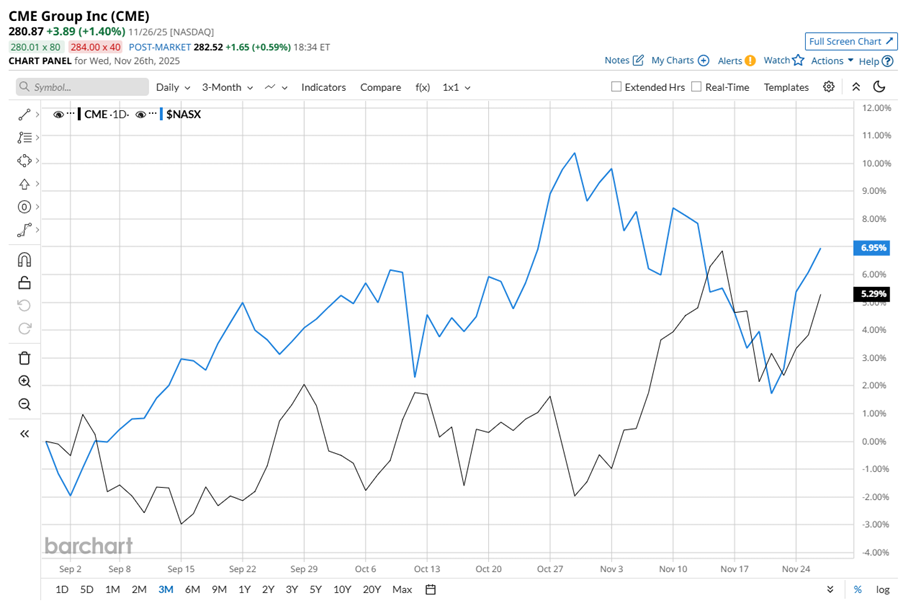
The longer-term picture adds even more clarity. CME stock has climbed 20.9% on a year-to-date (YTD) basis and surged 19.8% over the past 52 weeks. That performance slightly edges out the NASX’s YTD gains of 20.2%, though it narrowly trails the broader index’s 21.1% rise over the past year. CME may not be sprinting, but it is keeping pace and occasionally outshining the market’s fastest runners.
CME spent the entire past year trading above its 200-day moving average, touching the line briefly in September and October before lifting comfortably above it again in November – a classic long-term bullish structure. Short-term momentum, however, told a different story when the stock slipped below its 50-day moving average in mid-August. But November brought a reversal, with CME reclaiming the 50-day MA and signaling that momentum may be shifting in its favor once again – giving the stock a mostly bullish, but slightly mixed setup for now.
Still, investors have not ignored the rougher patches. One-year underperformance stems partly from softer quarterly trends and broader market caution surrounding exchange operators. CME’s Q3 FY25 revenue dipped 3% year over year (YoY) to $1.54 billion, matching expectations, while adjusted EPS held flat at $2.68 but topped consensus by a few cents. Even so, CME’s ability to post its second-highest third-quarter average daily volume (ADV) during market uncertainty reminded investors why the company remains a cornerstone of global trading activity.
And the momentum did not stop there. October delivered a record ADV of 26.3 million contracts, with cryptocurrency ADV exploding 226% to 379,000 contracts. November 21 pushed the boundaries even further, with CME’s crypto futures and options suite hitting an all-time daily record of 794,903 contracts. Year-to-date, crypto ADV has surged 132% with open interest up 82%, showing that CME is expanding it into high-growth frontiers.
Compared to rivals, CME’s strength becomes even clearer. Intercontinental Exchange, Inc. (ICE) managed only a 4.9% YTD rise and slipped 2.6% over the past year, underscoring CME’s relative outperformance and deeper investor confidence.
Analysts are cautiously optimistic about CME. The stock holds a “Moderate Buy” rating from 19 analysts, with an average price target of $288.53, implying about 2.7% upside from here.
On the date of publication, Sristi Jayaswal did not have (either directly or indirectly) positions in any of the securities mentioned in this article. All information and data in this article is solely for informational purposes. For more information please view the Barchart Disclosure Policy here.
More news from Barchart
- This AI Dividend Stock Is a Buy Even as the S&P 500’s Yield Falls to Dot-Com Lows
- Have You Heard of the ‘Wheel’ Strategy? These 3 Unusually Active Stocks to Buy Can Get You Started
- 3 Buy-Rated Dividend Aristocrats Easily Beating Inflation
- ‘Insatiable’ Demand Is Powering This ‘Picks and Shovels’ AI Stock up 245%. Should You Buy It Here?


