To be 100% blunt, if a trading analysis — especially one focused on options — doesn’t mention the concept of baseline versus conditional probabilities, it lacks utility to the point of being worthless. Yes, it’s a strong assertion but the rock-bottom standards in the financial publication industry desperately need to be elevated.
If we’re being intellectually honest, I’m not sure what the rebuttal would be.
Today’s options-focused report is going to be on Nike (NKE). Right now, the Barchart Technical Opinion indicator rates NKE stock as a 56% Sell, with an identified risk that the short-term picture could continue being negative. So, if I’m going to be bullish on NKE stock, don’t you think I need a quantified reason for my optimism?
Let’s look at the sport of baseball. Many of you watched the riveting World Series between the Los Angeles Dodgers and the Toronto Blue Jays. In most of the games, each team’s manager had to make critical personnel decisions. If they replace an arm or a bat, that player can’t come back later in the same game.
As such, managers must conduct Bayesian inferences, determining whether the potential reward of the substituted player exceeds the opportunity cost of keeping the lineup as is. That’s where you have to know the baseline probability (staying put) and the conditional probability (making a change).
It’s utterly irrational for a manager not to know these probabilities; that would be considered malpractice. And yet, in the financial realm, millions of retail traders trade options based on some rando’s opinion about intrinsic value or breakout patterns.
To be brutally candid, analyzing the options market is no replacement for calculating probabilities. While NKE stock represented one of the 500 names on Barchart’s Unusual Stock Options Volume list on Friday — and while options flow does show net trade sentiment at $292,000 — it’s difficult to extract meaning here.
At the end of the day, it’s a derivative market — and individual calls and puts can be traded for a variety of reasons.
Drilling into the Math Behind NKE Stock
At a minimum, every trading-centered analysis must contain the empirical probability, also known as the relative frequency. This is the number of times a specific event has occurred divided by the total number of observations. Further, a truly detailed analysis will feature a price clustering or density statistic; that is, the outcome that occurs most frequently.
Looking at NKE stock using data since January 2019, the 10-week forward outcomes form a distributional curve, with prices ranging from approximately $63.50 to $65.25 (assuming an anchor of $64.59, Friday’s close). Under baseline conditions, price clustering would be expected to occur at this level, a consequence of the week-to-week exceedance ratio ranging from roughly 46% to 52%.
However, the argument here is that NKE stock is not in a baseline or homeostatic state. Instead, the security is arranged in a 3-7-D formation: three up weeks, seven down weeks, with an overall downward slope. Under this sequence, NKE’s risk tail stays roughly the same but the reward tail jumps up to $67.50. Better yet, the exceedance ratio ranges from 51% to almost 60%.
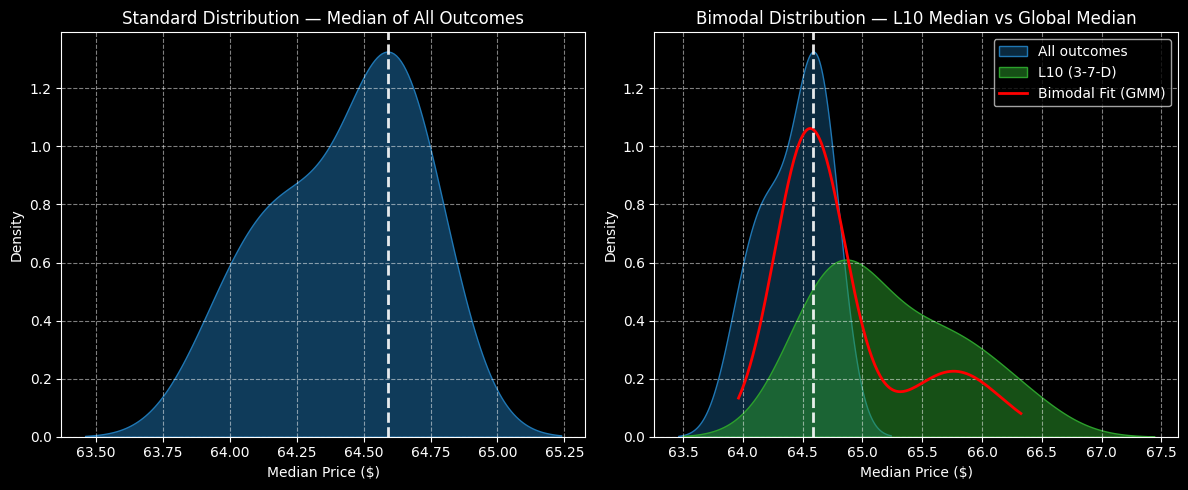
Also, price clustering would be expected to be predominant at $64.80. That means there’s a positive delta of nearly half-a-percent not being accounted for by market makers. Combined with the higher reward tail, the collective picture represents an informational arbitrage.
In all fairness, the above methodology isn’t common, which is why it may initially draw skepticism. However, the foundation of this quantitative model stems from observations made by GARCH (Generalized Autoregressive Conditional Heteroskedasticity) studies, which describe the diffusional properties of volatility as clustered, non-linear phenomena.
To put it simply, different market stimuli yield different market behaviors. Right now, NKE stock is not structured in a normal state but rather a distributive one. However, the red ink historically entices bullish activity. While it’s no guarantee that upside will commence, there is a better chance for it based on actual, empirical data.
Using Data to Guide Our Trades
With the market intelligence above, there are two intriguing ideas to consider. First, the more conservative approach is the 63/66 bull call spread expiring Nov. 28. This transaction involves buying the $63 call and simultaneously selling the $66 call, for a net debit paid of $164 (the most that can be lost in the trade).
Should NKE stock rise through the second-leg strike ($66) at expiration, the maximum profit is $136, a payout of nearly 83%. Here, the breakeven sits at $64.64, which is a realistic target given the price density dynamics associated with the 3-7-D sequence.
Those who want to dial up the aggression may consider the 63/67 bull spread, also expiring Nov. 28. This transaction requires a net debit of $201, with a maximum profit of $199, translating to a payout of 99%. In this case, the breakeven threshold stands at $65.01, which is a bit of a stretch but still within reason.
For both trades, a little bit of luck will be needed to trigger the maximum strike price. However, because investors tend to buy the dips — specifically under 3-7-D conditions — the odds may be more favorable than you might suspect.
On the date of publication, Josh Enomoto did not have (either directly or indirectly) positions in any of the securities mentioned in this article. All information and data in this article is solely for informational purposes. For more information please view the Barchart Disclosure Policy here.
More news from Barchart