
Sempra (SRE), based in San Diego, California, operates as an energy infrastructure company. Valued at $61.8 billion by market cap, the company focuses on delivering sustainable energy to consumers, as well as invests in, develops, and operates transmission and distribution infrastructures.
Companies worth $10 billion or more are generally described as “large-cap stocks,” and SRE perfectly fits that description, with its market cap exceeding this mark, underscoring its size, influence, and dominance within the utilities - diversified industry. Sempra boasts a robust market presence, driven by its extensive utility customer base in Southern California and Texas. Its stake in Sempra Infrastructure partners diversifies its portfolio and leverages cross-border energy trade opportunities, solidifying its position as a key player in the North American energy market.
Despite its notable strength, SRE slipped 4.4% from its 52-week high of $95.72, achieved on Oct. 8. Over the past three months, SRE stock gained 10.8%, outperforming the Utilities Select Sector SPDR Fund’s (XLU) 5% gains during the same time frame.
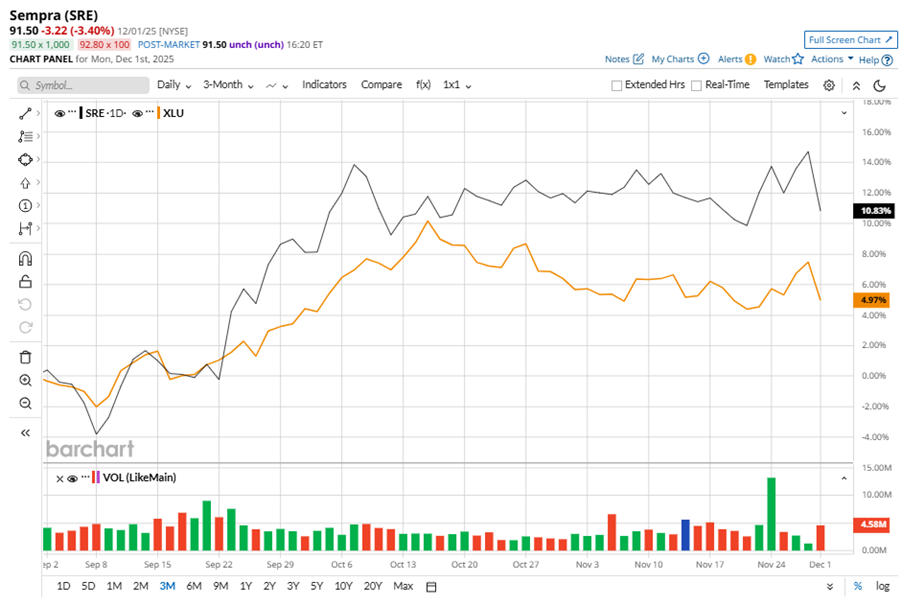
In the longer term, shares of SRE rose 4.3% on a YTD basis but dipped 2.3% over the past 52 weeks, underperforming XLU’s YTD gains of 16.9% and 6.7% returns over the last year.
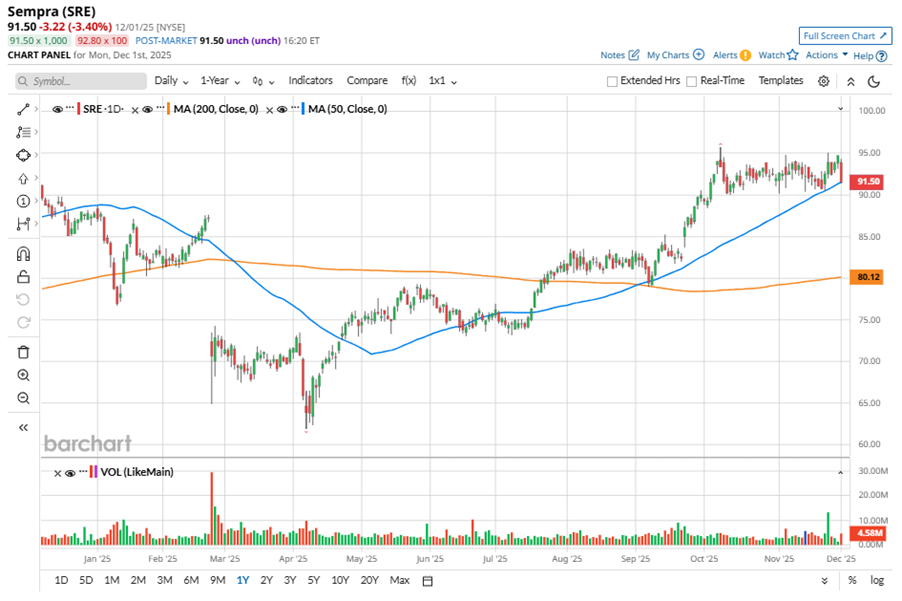
To confirm the bullish trend, SRE has been trading above its 50-day moving average since late April, experiencing slight fluctuations. The stock has been trading above its 200-day moving average since late July.
On Nov. 5, SRE shares closed down marginally after reporting its Q3 results. Its adjusted EPS of $1.11 topped Wall Street expectations of $0.93. The company’s revenue stood at $3.2 billion, up 13.5% year over year. SRE expects full-year adjusted EPS in the range of $4.30 to $4.70.
SRE’s rival, The AES Corporation (AES) shares have taken the lead over the stock, with an 8.7% uptick on a YTD basis and 7.3% gains over the past 52 weeks.
Wall Street analysts are reasonably bullish on SRE’s prospects. The stock has a consensus “Moderate Buy” rating from the 18 analysts covering it, and the mean price target of $100.86 suggests a potential upside of 10.2% from current price levels.
On the date of publication, Neha Panjwani did not have (either directly or indirectly) positions in any of the securities mentioned in this article. All information and data in this article is solely for informational purposes. For more information please view the Barchart Disclosure Policy here.
More news from Barchart
- Stock Index Futures Gain as Investors Recover Risk Appetite
- This Options Strategy Turns Your Stock Portfolio Into a Consistent Income Generator
- This ‘Strong Buy’ Dividend Stock Looks Set to Raise Payouts. Should You Buy Shares Now?
- JPMorgan Just Upgraded CleanSpark Stock. Should You Buy Shares Here?


