Global population growth increases the demand side of grain and oilseed fundamental equations, and each year, supplies must keep pace with the growing demand. The current price levels could limit downside risks, while the upside could be explosive if weather conditions create shortages.
I am cautiously bullish on grain and oilseed prices in 2026, as the risk-reward favors the upside.
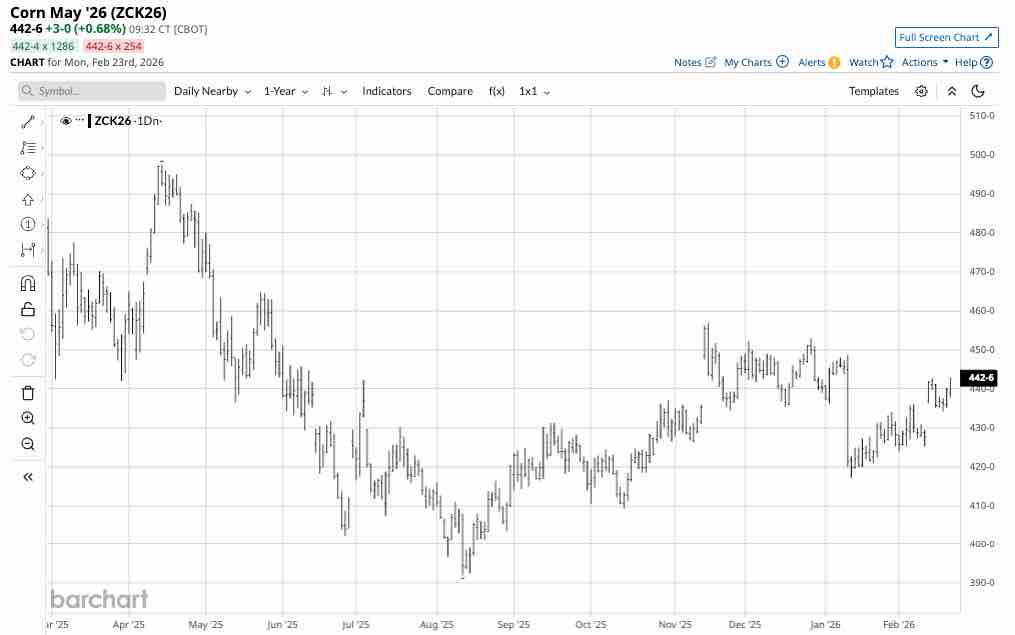
Nearby CBOT corn futures moved 3.98% lower in 2025, settling at $4.4025 per bushel on December 31, 2025. Over the past few weeks, corn prices have traded in a narrow range, remaining near the 2025 closing price.
Corn trades sideways with a slightly bullish bias
Daily nearby continuous CBOT corn futures have traded between $3.92 and $4.57 per bushel since August 12, 2025.
The daily continuous contract chart shows the pattern of higher lows and higher highs over since mid-August. Corn futures are rolling from the March to May contract, with the price for May delivery above $4.40 per bushel.
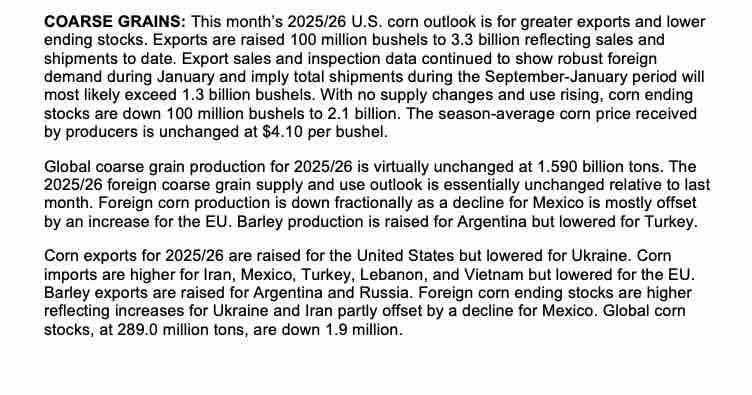
The February WASDE Report was not bearish
The U.S. Department of Agriculture released its February pre-2026 crop year World Agricultural Supply and Demand Estimates Report on February 10.
The USDA reported that U.S. and global corn stocks declined, which is not bearish for prices going into the 2026 crop year. I reached out to Jake Hanley, the Chief Growth Officer and Director of Investments at the Teucrium family of agricultural ETFs, for his opinion on corn after the most recent WASDE report. Jake told me:
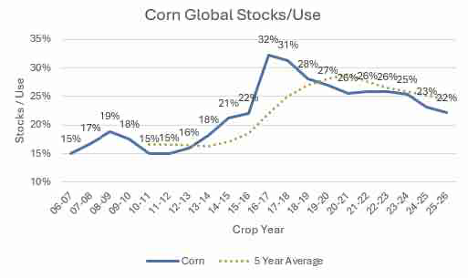
Of note is the continued strength in U.S. corn exports. The USDA’s upward revision today was a good reminder that while supplies are ample, demand remains robust and hence we have prices that are expected to be relatively range bound for some time. We’re keeping an eye on the global corn stocks/use ratio. Again, while there is plenty of corn, the fact is the global balance sheet continues to shrink. It’s worth keeping an eye on.
Source: Teucrium
The domestic soybean balance sheet is tight relative to corn, which could lead to ideas that bean prices will advance, or at least remain firm, relative to corn in effort to “bid for acres.” It’s likely corn will give way to some soybean acres this Spring.
If farmers plant more soybeans than corn during the 2026 planting season, corn’s price could benefit if U.S. and global inventories continue to decline.
The weather across the leading growing areas is critical for the price over the coming months
The great uncertainty in each new crop year is always weather conditions across the leading growing areas during the planting, growing, and harvest seasons. Corn futures could have bottomed in August 2025, after the last crop year produced ample supplies to meet global demand. However, 2025 supplies do not guarantee that the weather over the coming months will produce another bumper crop.
Levels to watch in corn- A switch from corn to soybeans could lift prices
Rising soybean prices, which could prompt farmers to shift acreage from corn to oilseeds, could exacerbate the already falling U.S. and global corn inventory landscape. Therefore, bullish price action in the beans could translate to the same in the corn futures market.
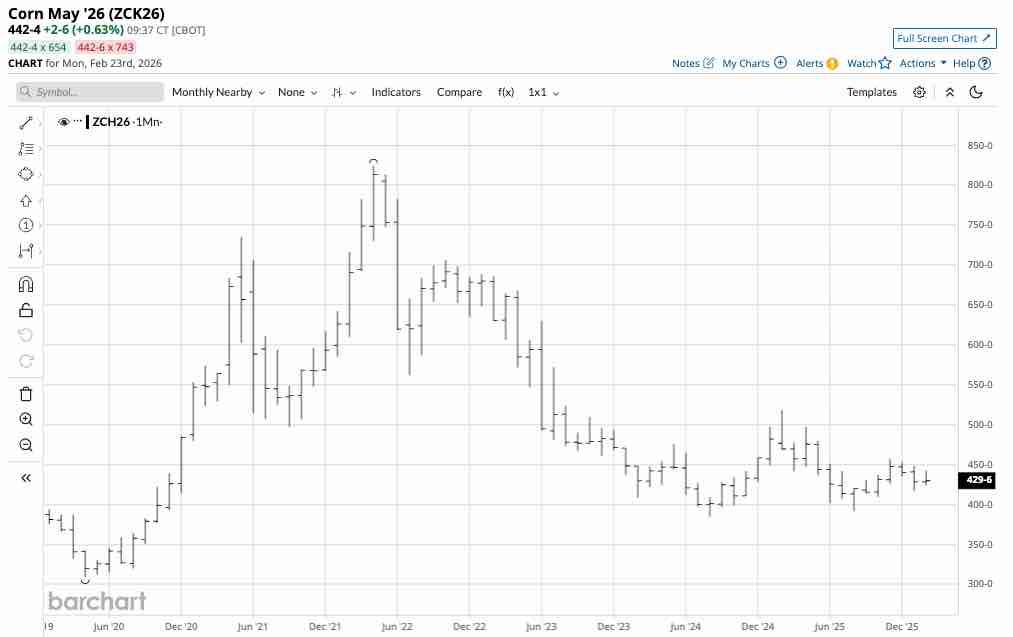
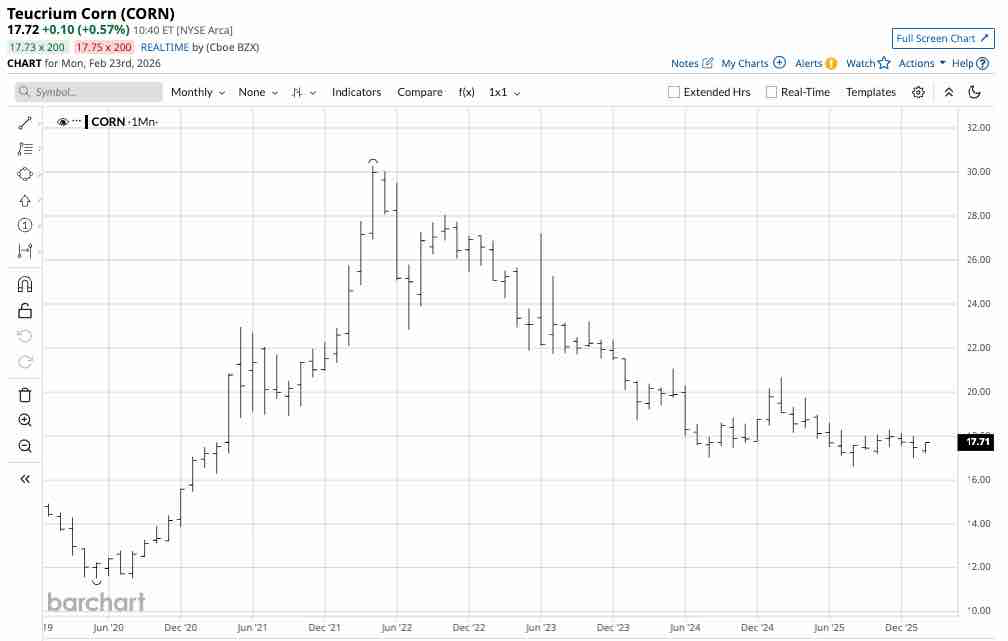
The monthly chart highlights the bearish price action since the April 2022 high. However, corn’s price has entered a consolidation period between $4 and $5 per bushel since hitting the 2024 low of $3.85 per bushel. Technical support is at $4 and $3.85 per bushel, with the first technical resistance level at the November 2025 high of $4.57. Above there, the next technical target is the February 2025 high of $5.1875 per bushel.
CORN is the ETF that tracks a portfolio of corn futures prices
The most direct route for a corn risk position is the futures and futures options on the CME’s CBOT division. The Teucrium Corn ETF (CORN) provides an alternative to the futures and trades on NYSE Arca, available to all market participants with a standard equity account. At $17.72 per share, CORN had $45.812 million in assets under management. CORN trades an average of over 58,200 shares daily and charges a 0.94% management fee. CORN owns a portfolio of three actively traded CBOT corn futures contracts, excluding the nearby contract, to mitigate futures roll risks. Since the most speculative activity occurs in the nearby contract, CORN tends to underperform the nearby contract on the upside and outperform it during price corrections.
The continuous corn futures rallied 16.58% from the August 2025 low to the November 2025 high. The most recent correction took the continuous contract price 8.70% lower from $4.5700 in November 2025 to $4.1725 per bushel in January 2026.
The monthly chart shows that over the same period, the CORN ETF rose 10.11% from $16.61 to $18.29 per share, before correcting 7.05% to $17.00 per share. CORN underperformed the nearby contract on the upside and outperformed on the downside, on a percentage basis.
One of the ETF’s drawbacks is that it trades only during U.S. stock market hours, so it can miss highs or lows when the market is closed.
The weather across the fertile growing regions, global corn demand, and producer hedging over the coming weeks will determine whether a bullish trend develops into the 2026 crop year, beginning with the planting season in March and April. The farmer’s decision to plant more beans than corn could be a critical factor in determining the path of least resistance for corn prices over the coming weeks and months.
On the date of publication, Andrew Hecht did not have (either directly or indirectly) positions in any of the securities mentioned in this article. All information and data in this article is solely for informational purposes. For more information please view the Barchart Disclosure Policy here.
Report this content
If you believe this article contains misleading, harmful, or spam content, please let us know.