Algorithm buying continued to drive the Grains sector higher last week, confirming what we knew by watching trends.
The corn market saw what looks to be a record one-week addition to its net-long futures position, despite market fundamentals remaining unchanged.
Don’t Miss a Day: From crude oil to coffee, sign up free for Barchart’s best-in-class commodity analysis.Soybeans continued to see big buying as well, with some spillover activity from the smaller soybean oil market likely.
Just over a year ago I wrote about how classic technical analysis (patterns, trendlines, etc.) has become obsolete due to the fact the algorithms creating trends don’t pay attention to such things. More recently, I posted a piece talking about how reads on real market fundamentals (intrinsic value, basis, futures spreads, forward curves) are largely ignored by Watson these days as well. What drives the algorithms, which in turn control trends? From the technical side it is a combination of momentum and volatility indicators, while fundamentally, unfortunately, it comes down to key words strategically placed in “news” headlines or social media posts, neither of which have to be the “Truth”, or highlighted numbers in government reports.
Over the past decade, I’ve often talked of the need for a third school of analysis, this one focusing solely on how to read and/or anticipate the next move by Watson. This is both an impossible task given the infinite possible equations being used across the industry, with a change in any one of the countless factors creating a different result (Chaos Theory), and a much easier job when it comes to analyzing market behavior.
- Newton’s First Law of Motion applied to markets: A trending market will stay in that trend until acted upon by an outside force. That outside force is usually (Vodka Vacuity) the flow of fund money, meaning algorithms (aka Watson).
- Given trends are set by funds, Newsom’s Market Rule #1 says: Don’t get crossways with the trend. It is usually not profitable to step in front of large global investment money. And no, I don’t want to have the age-old argument of funds as trend setters versus trend followers. Watson sets the trend. End of story.
- Why do funds change money flow in individual markets or market sectors? First, we don’t know. As I said before it could be for any reason imaginable or unimaginable. Second, it doesn’t matter. Newsom’s Market Rule #5 tells us: It’s the what not the why. And by “what”, I mean buying or selling. That’s it.
- How do we track fund activity? We start with simple trend – price direction over time – with an uptrend reflecting buying in a market while a downtrend tells us funds are selling. Again, this evolution has made my job easier. To confirm what I see in trends I look at weekly CFTC Commitments of Traders reports. And has been well documented, discussed, and disagreed with, I continue to use the Legacy/Futures only numbers. Again, I’m done debating this. The reports aren’t that important beyond telling me what I already know.
Let’s take a look at the latest Commitments of Traders report, the noncommercial net futures positions in particular, to answer the question of what is driving Grains markets these days.
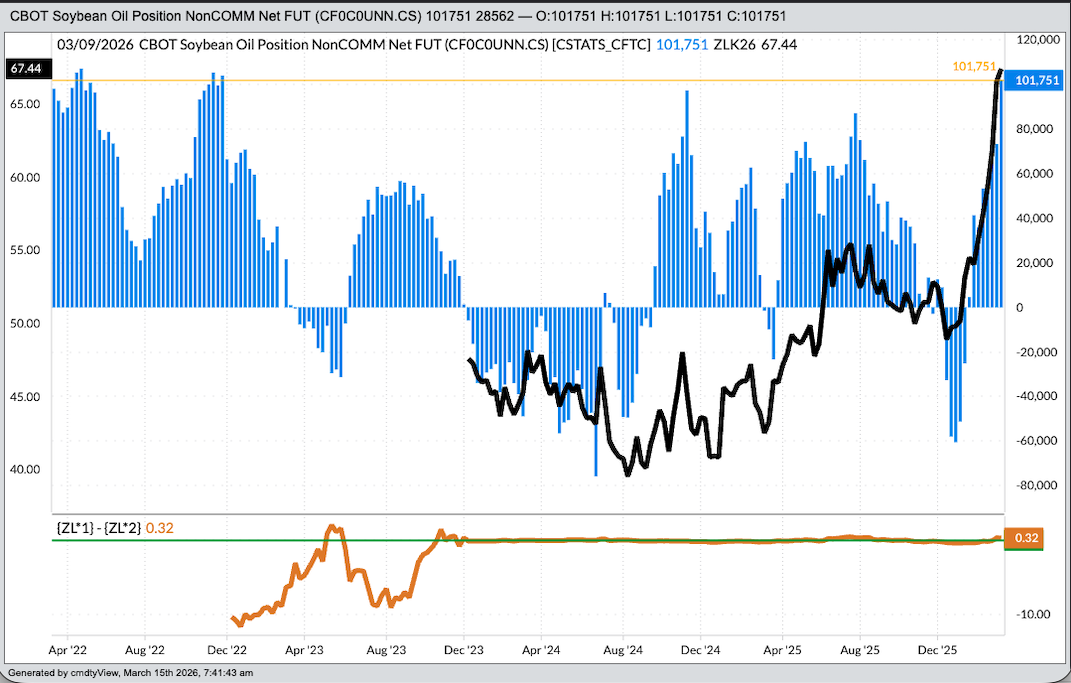
Soybean Oil: Noncommercial traders held a net-long futures position of 101,751 contracts, an increase of 28,562 contracts as of Tuesday, March 10, the largest noncommercial net-long futures position since 103,854 contracts on Tuesday, November 29, 2022.
- This included an increase in long futures of 9,996 contracts
- And a decrease in short futures by 18,566 contracts
- The noncommercial futures position has moved from a net-short of 60,440 contracts on December 30 to the most recent number, a switch 162,190 contracts.
- While the May futures contract (ZLK26) has rallied from 48.92 (cents) to the recent weekly close of 67.44, a gain of 18.52 (38%).
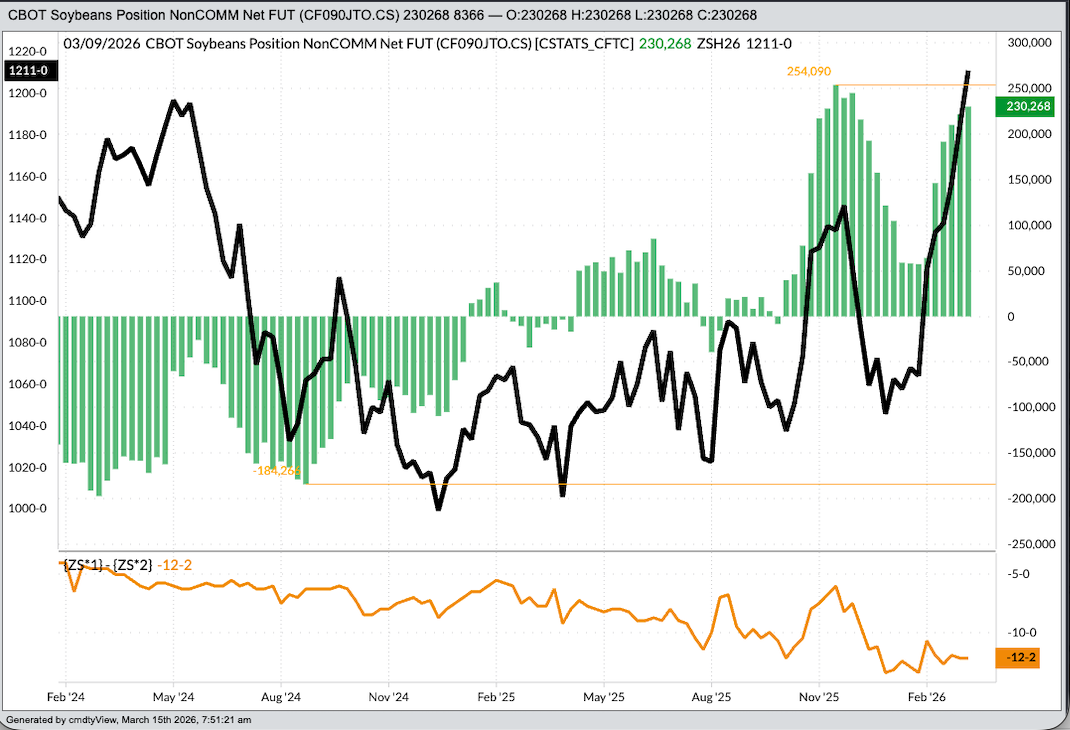
Soybeans: Due in part to spillover buying from soybean oil as Watson looks for a bigger market, noncommercial traders held a net-long futures position of 230,268 contracts, an increase of 8,366 contracts as of Tuesday, March 10. It’s interesting to note the net-long position again came up short of last fall’s peak number of 254,090 contracts.
- This included an increase in long futures of 4,531 contracts
- And a decrease in short futures by 3,835 contracts
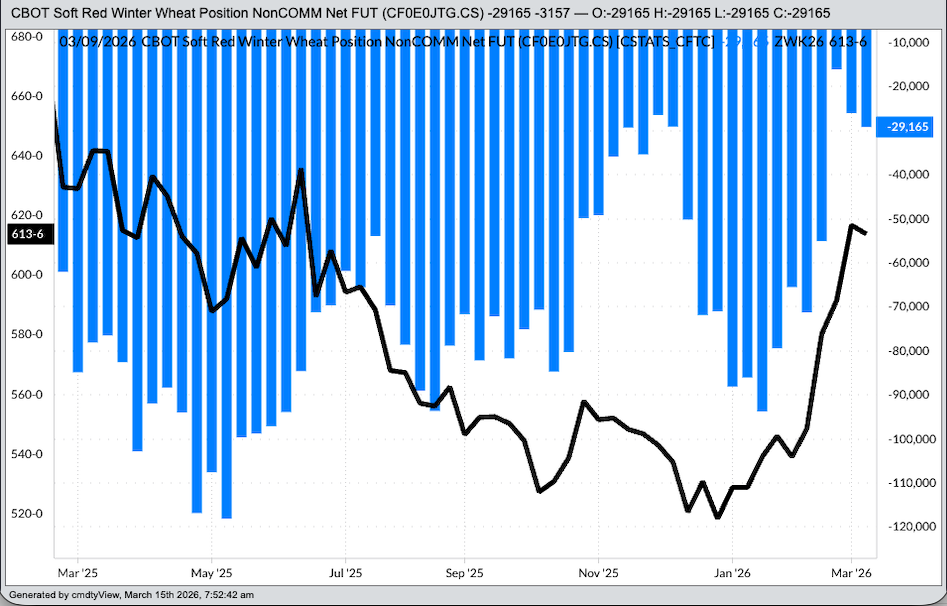
SRW Wheat: Here we see Watson being stubborn given the latest report showed net-long futures positions in both HRW and HRS wheat markets. As for SRW, noncommercial traders held a net-short futures position of 29,165 contracts, an increase of 3,157 contracts as of Tuesday, March 10.
- This included a decrease in long futures by 175 contracts
- And an increase in short futures of 2,982 contracts
- This is a more bearish change given it was driven by adding new short futures
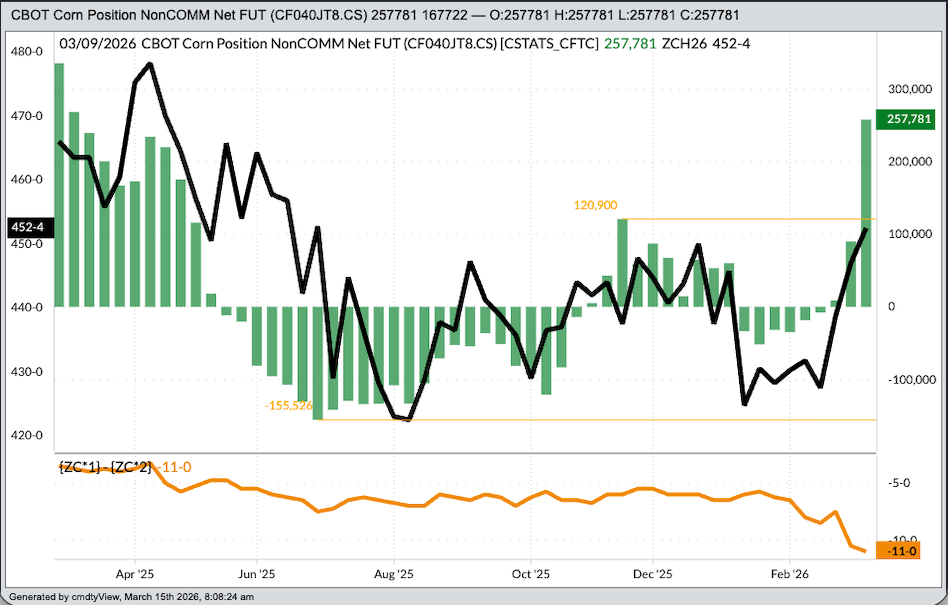
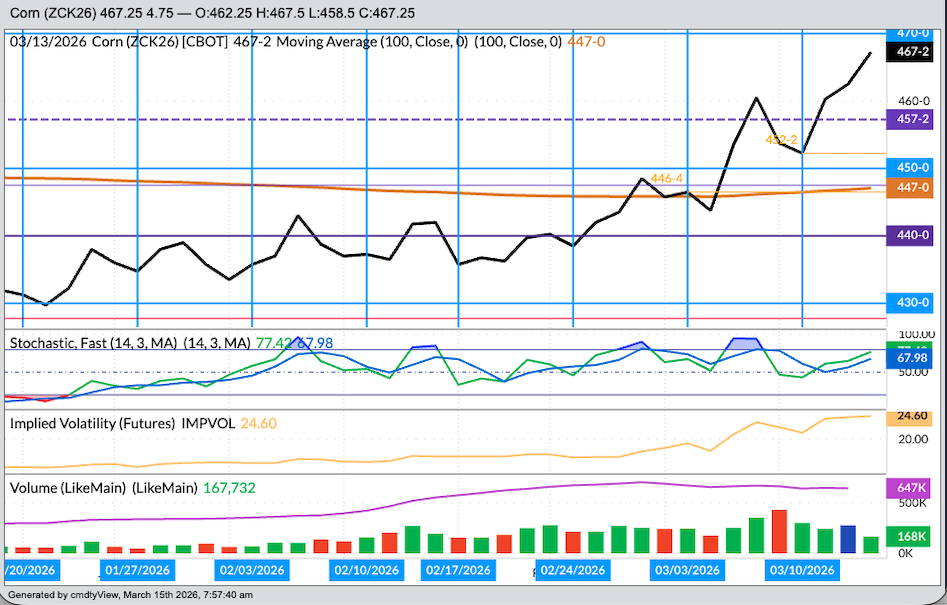
Corn: The King of the Grains sector had a big(ly?) week. The latest Commitments of Traders report showed noncommercial traders held a net-long futures position of 257,781 contracts, an increase of 167,722 contracts as of Tuesday, March 10.
- From what I can tell going back through corn’s noncommercial numbers, last week’s change looks to be a record large addition to the net-long futures position.
- This included an increase in long futures of 110,631 contracts
- And a decrease in short futures by 57,091 contracts
- However, things could quickly get interesting for King Corn as the May issue showed daily implied volatility of 24.6% at last Friday’s close. Recall one of the technical factors Watson supposedly uses is volatility, so the increase from 14.5% from late January could lead to long liquidation, while the balance of market factors remains largely unchanged.
Last but certainly not least, a quick look at our long-term investment positions in the Grains sector via the Teucrium Corn, Soybean, and Wheat Exchange Trade funds continue to be improved by Watson. Since the end of December 2025:
Did anyone have WEAT as the Q1 leader on their investment Bingo card? Anyone? Bueller?
On the date of publication, Darin Newsom did not have (either directly or indirectly) positions in any of the securities mentioned in this article. All information and data in this article is solely for informational purposes. For more information please view the Barchart Disclosure Policy here.
More news from Barchart