Summary
Sphere Entertainment (SPHR) exhibits strong technical momentum, recently hitting a 5-year high of $127.41 and gaining nearly 280% over the past year.
SPHR holds a 100% 'Buy' technical opinion from Barchart, with a Trend Seeker 'Buy' signal intact and a Weighted Alpha of +345.63.
Join 200K+ Subscribers: Find out why the midday Barchart Brief newsletter is a must-read for thousands daily.Revenue is projected to grow 10.32% this year, but earnings are expected to decrease by 182.96% before rebounding 14.54% next year.
Despite bullish technicals and analyst sentiment, elevated short interest at 19.84% warrants close monitoring before making allocation decisions.
Today’s Featured Stock
Valued at $4.25 billion, Sphere Entertainment SPHR is a premier live entertainment and media company. The Company includes Sphere, a next-generation entertainment medium which will redefine the future of entertainment. Sphere Entertainment Co., formerly known as Madison Square Garden Entertainment Corp., is based in New York.
What I’m Watching
I found today’s Chart of the Day by using Barchart’s powerful screening functions to sort for stocks with the highest technical buy signals; superior current momentum in both strength and direction; and a Trend Seeker “buy” signal. I then used Barchart’s Flipcharts feature to review the charts for consistent price appreciation. SPHR checks those boxes. Since the Trend Seeker issued a new “buy” on March 31, SPHR stock is up 8.36%.
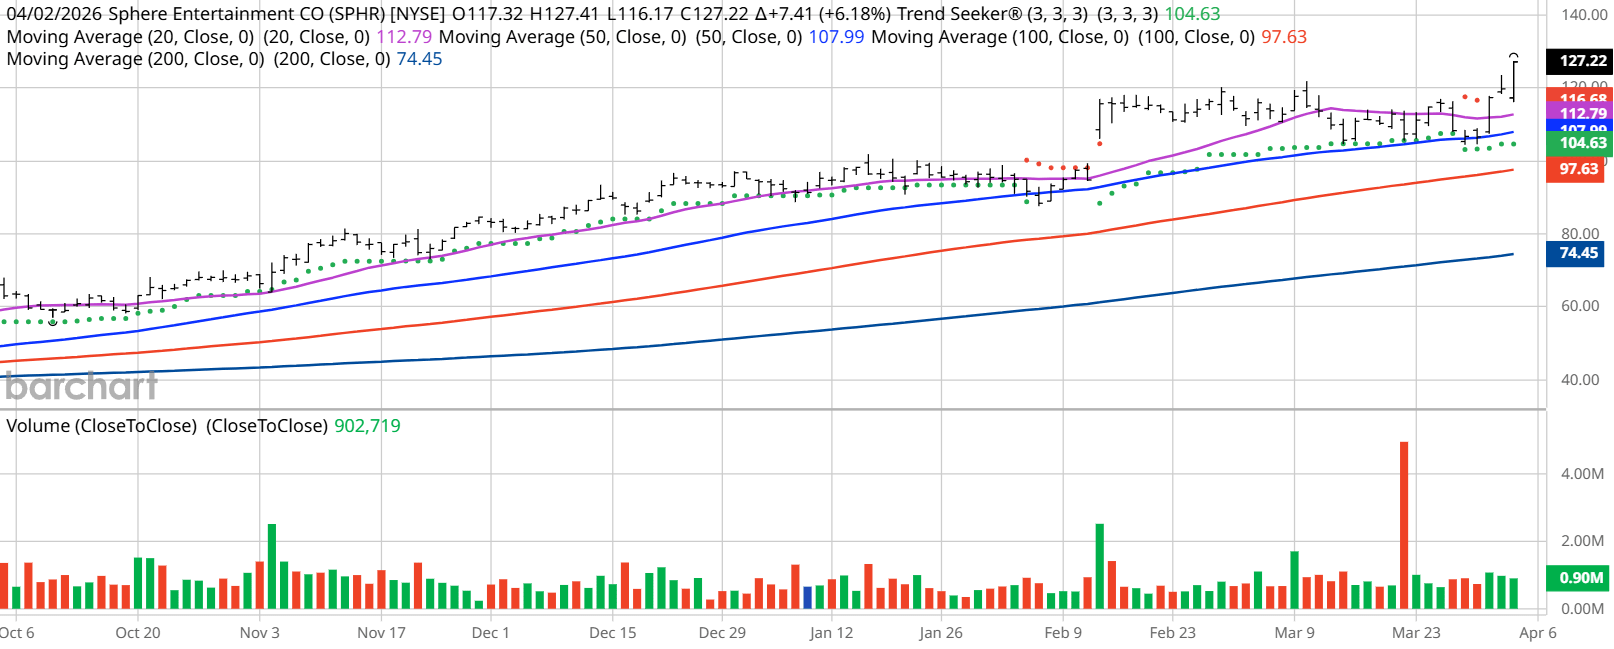
SPHR (Barchart)
Barchart Technical Indicators for Sphere Entertainment
Editor’s Note: The technical indicators below are updated live during the session every 20 minutes and can therefore change each day as the market fluctuates. The indicator numbers shown below therefore may not match what you see live on the Barchart.com website when you read this report. These technical indicators form the Barchart Opinion on a particular stock.
Sphere scored a 5-year high of $127.41 on April 2.
- Sphere has a Weighted Alpha of +345.63.
- SPHR has a 100% “Buy” opinion from Barchart.
- The stock has gained 279.99% over the past 52 weeks.
- Sphere has its Trend Seeker “Buy” signal intact.
- The stock recently traded at $127.22 with a 50-day moving average of $107.99.
- SPHR has made 6 new highs and gained 11.21% over the past month.
- Relative Strength Index (RSI) is at 65.84.
- There’s a technical support level around $119.79.
Don’t Forget the Fundamentals
- $4.25 billion market capitalization.
- Revenue is expected to grow 10.32% this year and another 1.84% next year.
- Earnings are estimated to decrease by 182.96% this year but increase again by 14.54% next year.
Analyst and Investor Sentiment on Sphere Entertainment
- The Wall Street analysts followed by Barchart gave the stock 9 “Strong Buy” 1 "Moderate Buy" and 3 “Hold” opinions with price targets between $110 and $150.
- Value Line gives the stock its “Above Average” rating.
- CFRA’s MarketScope rates the stock a “Hold.”
- Morningstar thinks the stock is 10% overvalued.
- Only 1 investor following the stock on Motley Fool think it will beat the market.
- 9,750 investors are following the stock on Seeking Alpha which rates it a “Strong Buy.”
- Short interest is only 19.84% of the float with 7.46 days to cover the float.
The Bottom Line on Sphere Entertainment
Analysts are not having great Earnings projections for this year. The Short Interest is a very high 19.84%. This bothers me. Monitor the Short Interest and see where it goes before making your decision.
Additional disclosure: The Barchart Chart of the Day highlights stocks that are experiencing exceptional current price appreciation. They are not intended to be buy recommendations as these stocks are extremely volatile and speculative. Should you decide to add one of these stocks to your investment portfolio it is highly suggested you follow a predetermined diversification and moving stop loss discipline that is consistent with your personal investment risk tolerance.
On the date of publication, Jim Van Meerten did not have (either directly or indirectly) positions in any of the securities mentioned in this article. All information and data in this article is solely for informational purposes. For more information please view the Barchart Disclosure Policy here.