I asked if gold was on its way to another new high in a March 3, 2026, Barchart article. I concluded with the following:
Meanwhile, the trend in any market is always a trader’s or investor’s best friend, and it remains bullish in gold in early March 2026. Time will tell if gold prices eclipse the Q1 2026 high of $5,626.80 on the continuous COMEX futures contract from April through June to establish the eleventh consecutive quarterly record high. Given the powerful demand for gold and central bank buying, the odds favor higher highs over the coming months.
Don’t Miss a Day: From crude oil to coffee, sign up free for Barchart’s best-in-class commodity analysis.
The June COMEX gold futures settled at $5,351.70 on March 2, and have dropped by over $650 per ounce in early April. Gold’s correction continues despite the ongoing war in Iran, as the dollar has rallied, bonds have declined, and markets remain nervous.
Risk-off conditions in gold
Gold faced bullish and bearish factors in March. On the bullish side, geopolitical turmoil in the Middle East has historically been a bullish factor for the leading precious metal. Military operations between the U.S./Israel, and Iran and threats about the Strait of Hormuz, a critical logistical petroleum chokepoint, lifted oil prices to over $100 per barrel for the first time since 2022. Higher oil prices lead to elevated inflation, which tends to support higher gold prices. However, the Middle East conflict, which has included Iranian attacks on most neighboring countries, has led to some risk-off behavior in markets, including stocks, bonds, cryptocurrencies, and metals.
Meanwhile, gold’s explosive move in 2025 and January 2026, which took the price to the most recent high of $5,666.60 on the June COMEX contract, fell victim to the risk-off selling.
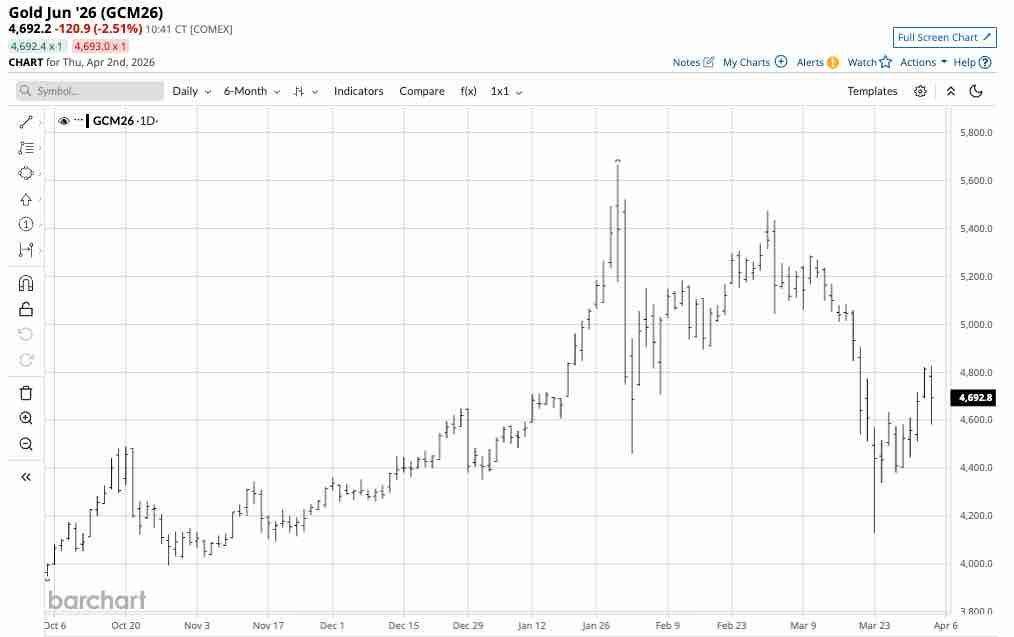
The daily chart shows that June gold futures fell 27.14% from the January 29, 2026, high of $5,666.60 to the latest low on March 23, 2026, of $4,128.50 per ounce. The bearish influence of risk-off behavior in markets dominated the gold market in February and March, likely due to increased long risk positions during the explosive price action in 2025 and January 2026, and long liquidation in February and March.
The bullish trend remains intact
While gold price dropped by over 27% from the late January high to the low on March 23, gold’s bullish trend is 27 years in the making, and the precious metal just completed its 10th consecutive quarter in which the price reached a new record high.
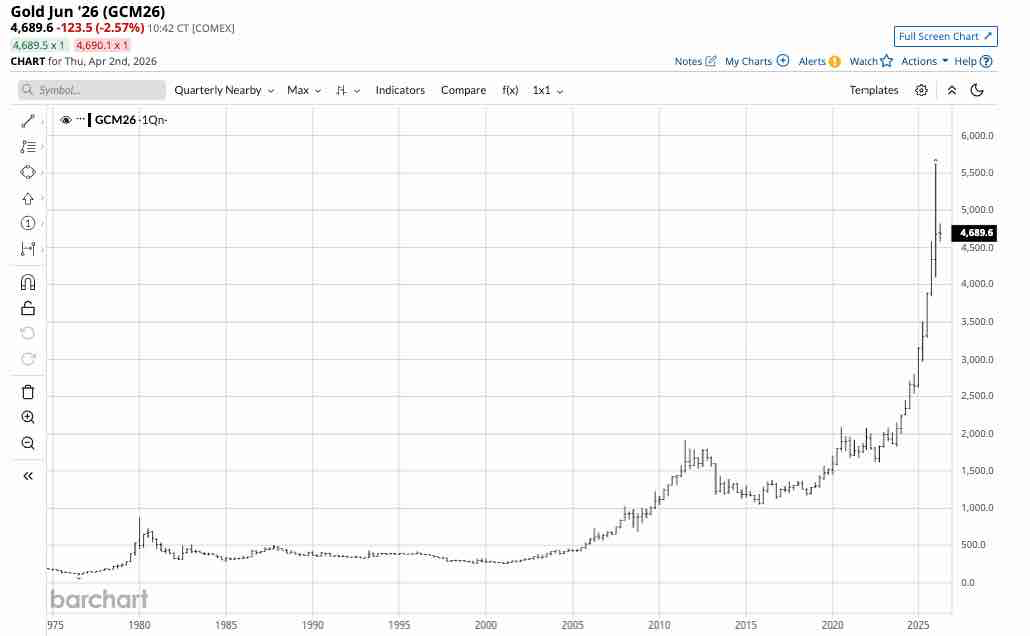
The quarterly chart shows that gold’s long-term bullish trend remains firmly intact despite the selloff from late January through March 23. Moreover, gold has experienced several corrections since the low in 1999 that began the multidecade bull market. The explosive price action in 2024 through January 2026 caused gold’s price to more than double; the downside correction was likely overdue.
Gold searches for a bottom
Gold’s most recent low on the continuous futures contract was at $4,100 per ounce. While the price remains closer to the March 23 low than the January 29 high, the long-term trend remains higher, and gold is searching for a bottom in early Q2 2026. Time will tell whether the streak of quarterly new highs, which reached 10 in Q1 2026, continues in Q2. With gold trading near the $4,690 level on April 3 on the continuous futures contract, it would need to rally by over $930 per ounce to achieve the eleventh consecutive quarterly new high by the end of June 2026.
Buying on corrections has been optimal throughout this century
Gold’s bull market began in 1999 at $252.50 per ounce. At the recent late January high, gold had moved over twenty-two times higher in 27 years. However, even the most aggressive bull markets rarely move in straight lines, and gold’s nearly three-decade bull market has experienced significant percentage corrections on its way to higher highs.
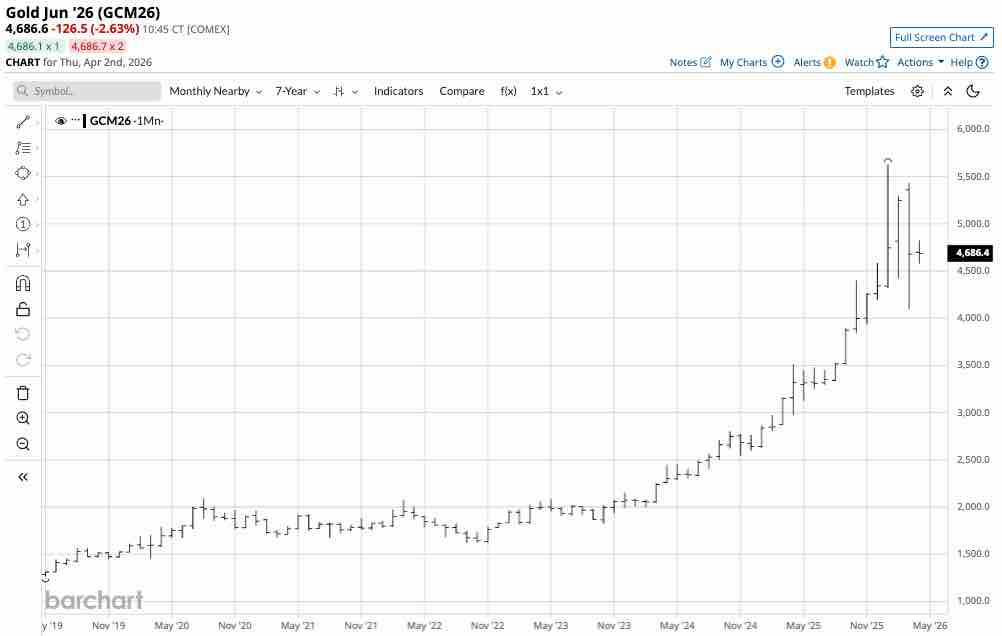
The seven-year COMEX gold futures chart shows that the futures fell 19.7% from the August 2020 high of $2,089.20 to the August 2021 low of $1,675.90 per ounce. The gold futures corrected 22.2% from the March 2022 high of $2,078.80 to the November 2022 low of $1,618.30 per ounce. Gold has corrected by over 20% several times since the turn of this century. However, each correction has been a buying opportunity, leading to a new record high in late January 2026.
While the current correction could be deeper and could take longer, the odds continue to favor a recovery as the long-term bullish trend remains firmly intact. Buying gold on a scale-down basis during corrections has been optimal this century, and I expect that trend to continue.
Three gold ETFs that own physical gold bullion
The most direct route for a gold investment is the physical market for bars and coins. However, investing in physical gold can involve paying premiums for buyers and accepting discounts for sellers. Moreover, owning physical gold requires storage and insurance considerations.
Three physical gold ETFs that hold physical gold bullion are:
- The Gold SPDR (GLD): GLD was the first gold ETF and remains the most liquid product that holds physical gold bullion. At $427.73 per share, GLD had over $160.4 billion in assets under management. GLD trades an average of more than 15 million shares per day and charges a 0.40% management fee.
- The iShares Gold Trust (IAU): At $87.65 per share, IAU had over $76.3 billion in assets under management invested in physical gold bullion. IAU trades an average of over 15.7 million shares per day and charges a 0.25% management fee.
- The Granite Shares Gold Trust (BAR): At $45.88 per share, BAR had over $1.64 billion in assets under management invested in physical gold bullion. BAR trades an average of over 514,000 shares per day and charges a 0.17% management fee.
GLD, IAU, and BAR are three highly liquid ETFs that hold physical gold and track gold prices. After correcting from the late January record high, a scale-down buying approach, leaving plenty of room to add on further declines, could be optimal, as gold’s bull market remains firmly intact in April 2026.
On the date of publication, Andrew Hecht did not have (either directly or indirectly) positions in any of the securities mentioned in this article. All information and data in this article is solely for informational purposes. For more information please view the Barchart Disclosure Policy here.