SS&C GlobeOp Forward Redemption Indicator: September notifications 2.02%
SS&C Technologies Holdings, Inc. (Nasdaq: SSNC) today announced the SS&C GlobeOp Forward Redemption Indicator for September 2026 measured 2.02%, up from 1.64% in August.
This press release features multimedia. View the full release here: https://www.businesswire.com/news/home/20260922257388/en/
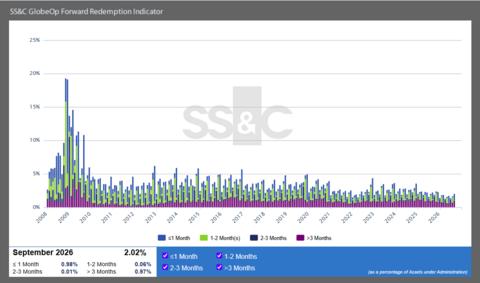
SS&C GlobeOp Forward Redemption Indicator
“SS&C GlobeOp’s Forward Redemption Indicator for September 2026 was 2.02%, which was lower than the 2.21% reported for the same period a year ago and consistent with seasonal patterns,” said Bill Stone, chairman and chief executive officer of SS&C Technologies. “Redemptions continue to trend favorably against an ongoing backdrop of economic uncertainty, global tensions, and elevated market volatility. Investors continue to value the diversification and attractive risk-adjusted returns offered by hedge funds.”
The SS&C GlobeOp Forward Redemption Indicator represents the sum of forward redemption notices received from investors in hedge funds administered by SS&C GlobeOp on the SS&C GlobeOp platform, divided by the AuA at the beginning of the month for SS&C GlobeOp fund administration clients on the SS&C GlobeOp platform. Forward redemptions as a percentage of SS&C GlobeOp's assets under administration on the SS&C GlobeOp platform have trended significantly lower since reaching a high of 19.27% in November 2008. The next publication date is October 21, 2026.
Published on the 15th business day of the month, the SS&C GlobeOp Forward Redemption Indicator presents a timely and accurate view of the redemption pipeline for investors in hedge funds on the SS&C GlobeOp administration platform. Movements in the Indicator reflect investor confidence in their allocations to hedge funds. Indicator data is based on actual investor redemption notifications received. Unlike subscriptions, redemption notifications are typically received 30-90 days in advance of the redemption date. Investors may, and sometimes do, cancel redemption notices. In addition, the establishment and enforcement of redemption notices may vary from fund to fund.
SS&C GlobeOp Hedge Fund Performance Index
Base |
100 points on 31 December 2005 |
|
Flash estimate (current month) |
0.83%* |
|
Year-to-date (YTD) |
8.63%* |
|
Last 12 month (LTM) |
14.90%* |
|
Life to date (LTD) |
380.45%* |
|
*All numbers reported above are gross |
SS&C GlobeOp Capital Movement Index
Base |
100 points on 31 December 2005 |
|
All time high |
150.77 in September 2013 |
|
All time low |
99.67 in January 2006 |
|
12-month high |
133.10 in September 2026 |
|
12-month low |
127.49 in October 2025 |
|
Largest monthly change |
- 15.21 in January 2009 |
SS&C GlobeOp Forward Redemption Indicator
All time high |
19.27% in November 2008 |
|
All time low |
1.26% in April 2026 |
|
12-month high |
2.43% in November 2025 |
|
12-month low |
1.26% in April 2026 |
|
Largest monthly change |
9.60% in November 2008 |
About the SS&C GlobeOp Hedge Fund Index®
The SS&C GlobeOp Hedge Fund Index (the Index) is a family of indices published by SS&C GlobeOp. A unique set of indices by a hedge fund administrator, it offers clients, investors and the overall market a welcome transparency on liquidity, investor sentiment and performance. The Index is based on a significant platform of diverse and representative assets.
The SS&C GlobeOp Capital Movement Index and the SS&C GlobeOp Forward Redemption Indicator provide monthly reports based on actual and anticipated capital movement data independently collected from all hedge fund clients for whom SS&C GlobeOp provides administration services on the SS&C GlobeOp platform.
The SS&C GlobeOp Hedge Fund Performance Index is an asset-weighted benchmark of the aggregate performance of funds for which SS&C GlobeOp provides monthly administration services on the SS&C GlobeOp platform. Flash estimate, interim and final values are provided, in each of three months respectively, following each business month-end.
While individual fund data is anonymized by aggregation, the SS&C GlobeOp Hedge Fund Index data will be based on the same reconciled fund data that SS&C GlobeOp uses to produce fund net asset values (NAV). Funds acquired through the acquisition of Citi Alternative Investor Services are integrated into the index suite starting with the January 2017 reporting periods. SS&C GlobeOp’s total assets under administration on the SS&C GlobeOp platform represent approximately 10% of the estimated assets currently invested in the hedge fund sector. The investment strategies of the funds in the indices span a representative industry sample. Data for middle and back office clients who are not fund administration clients is not included in the Index, but is included in the Company’s results announcement figures.
About SS&C Technologies
SS&C is a leading provider of mission-critical, AI-powered technology and services empowering financial services and healthcare organizations to work smarter, faster, and securely. Founded in 1986, SS&C is headquartered in Windsor, Connecticut, and has offices worldwide. More than 23,000 financial services and healthcare organizations, from the world's largest companies to small and mid-market firms, rely on SS&C for expertise, scale and technology.
SOURCE: SS&C
Additional information about SS&C (Nasdaq: SSNC) is available at www.ssctech.com.
Follow SS&C on X, LinkedIn and Facebook.
View source version on businesswire.com: https://www.businesswire.com/news/home/20260922257388/en/
“Redemptions continue to trend favorably against an ongoing backdrop of economic uncertainty, global tensions, and elevated market volatility. Investors continue to value the diversification and attractive risk-adjusted returns offered by hedge funds.”
Contacts
For more information
Brian Schell
Chief Financial Officer
SS&C Technologies
Tel: +1-816-642-0915
Email: InvestorRelations@sscinc.com
Justine Stone
Investor Relations
SS&C Technologies
Tel: +1-212-367-4705
Email: InvestorRelations@sscinc.com
Media Contact
Prosek Partners
Email: pro-SSC@prosek.com