Stock West and Stock Main gold resources increase by 31%, mineralization continuing at depth;
Stock East emerging as a potential new source of near-term production. Assay highlights:
Drillhole SEZ24-86: 121.5 g/t Au over 0.4 m (3.91 oz/t Au over 1.3 ft) (Fig. 2)
Drillhole SEZ24-84: 6.5 g/t Au over 10.2 m (0.21 oz/t Au over 33.5 ft) (Fig. 3)
Drillhole SEZ24-88: 4.5 g/t Au over 10.4 m (0.14 oz/t Au over 34.1 ft) (Fig. 3)
(All assay values are true widths)
TORONTO, Feb. 28, 2024 (GLOBE NEWSWIRE) -- McEwen Mining Inc. (NYSE: MUX) (TSX: MUX) is pleased to report on three outcomes of its large exploration investment at the Stock Mine property, part of the Fox Complex, in the prolific Timmins gold district of Northern Ontario, Canada: One, a 31% year over year increase of gold resources at Stock West and Stock Main (historical Stock Mine), with Two, confirmation of good grading structures plunging to depth; and Three, Stock East emerging as a potential new near-term source of future revenue.
31% Resource Growth (Inferred + Indicated) and the Importance of Structures at Stock West and Main
Geological interpretations suggest that two principal structures that plunge to depth, emanating from the historical Stock Mine (see Fig. 1) control the mineralization of Stock West and Stock Main. Resources identified within these structures in 2023 account for most of the 31% increase in the Stock West and Main resource (see Table 2) when compared to year end 2022. The infill drilling at Stock West completed in 2023 demonstrated an increase in the widths of the mineralized zones with a slight decrease in the overall grade. Drilling along the deeper part of structures accounts for about half of the 31% increase in the updated resource estimate and demonstrates the potential for these structures to extend to depth and remain highly prospective for additional exploration and resource growth.
Stock East Emerging
Drilling in late 2023 and continuing into 2024 was designed to assess Stock East’s potential to be a shallow source of near-term revenue during the construction phase of the access ramp at Stock West. Assay results from the infill drill program successfully identified mineable widths and grades. In addition, the block model updated in 2022 has been successful in forecasting the projected grades and widths for the new drilling. Stock East mineralization appears to be controlled by two plunge directions, with one similar to that seen for the rest of Stock structures (see Fig. 1 in upper right-hand corner and Fig. 3)
An assay result from drillhole SEZ24-86 that returned 121.5 grams per tonne (g/t) gold (Au) over 0.4 meters (m), equivalent to 3.91 ounces per tonne (oz/t) Au over 1.3 ft (see Fig. 2), is very intriguing because of its high grade, proximity to surface and position outside the main mineralized zone (lying approximately 75 m in the hanging wall to the main Stock East zone). Its orientation suggests that earlier drilling may have missed other possible high-grade occurrences. To date, all of the drilling at Stock East has been in a mostly North to North-West orientation, therefore this particular intercept may have been mostly missed. Additional follow-up drilling is warranted to determine its true geometry.
Some of the key drill results from our recent drilling programs are listed below; see Fig. 3: Also shown in Fig. 3 are earlier assay values of attractive grades and widths.
| SEZ23-69: SEZ24-71: SEZ24-84: SEZ24-85: SEZ24-88: | 7.1 g/t Au over 4.8 m 4.5 g/t Au over 7.7 m 6.5 g/t Au over 10.2 m 3.5 g/t Au over 5.3 m 4.5 g/t Au over 10.4 m | 0.23 oz/t Au over 15.8 ft 0.14 oz/t Au over 25.3 ft 0.21 oz/t Au over 33.5 ft 0.11 oz/t Au over 17.4 ft 0.14 oz/t Au over 34.1 ft |
The location of Stock East is strategic for multiple reasons:
From a geological perspective:
The Stock East zone lies close to the splay point of the NE-SW trending Nighthawk Lake fault and the E-W trending regional Destor-Porcupine fault (see Fig. 2). Such splays are known in the district to be good traps for gold mineralization. The host rocks at Stock East are a combination of altered mafic & ultramafic volcanics and quartz breccias.
From an operational perspective:
It is located only 700 meters East of our mill (see Fig. 1); Stock East is a shallow deposit positioned just 400 meters from the proposed ramp to Stock West, that could be quickly and inexpensively accessed; and it could potentially provide early revenue during the construction of the Stock West ramp.
The current drilling program aims to upgrade the majority of the Inferred mineralization to the Indicated category while also targeting higher grade (>10 GxM, grade x true width) sections of the zone. We are also updating the resource for Stock East to include these new intercepts, targeting completion by the end of Q1 2024 (see Table 1).
Figure 1: Longitudinal section looking North, extending from Stock West to Stock East and showing the principal plunge directions which control most the mineralization on the Stock property
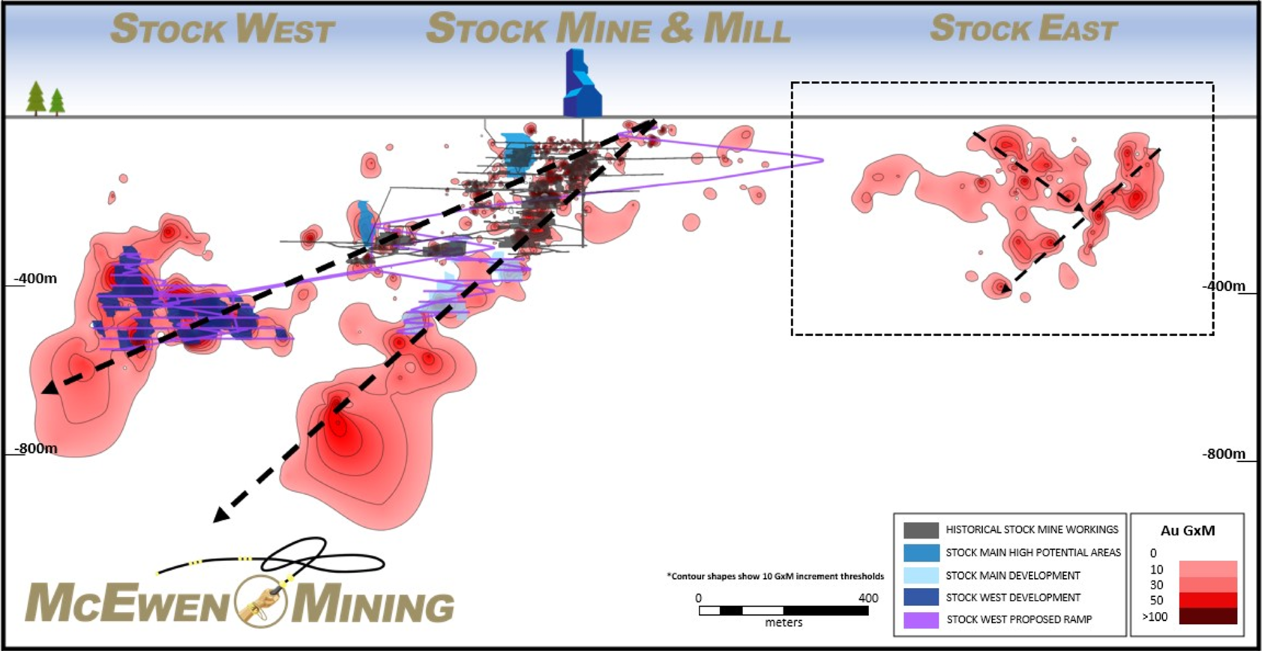
Figure 2: Plan view of the mineralization seen on the Stock property
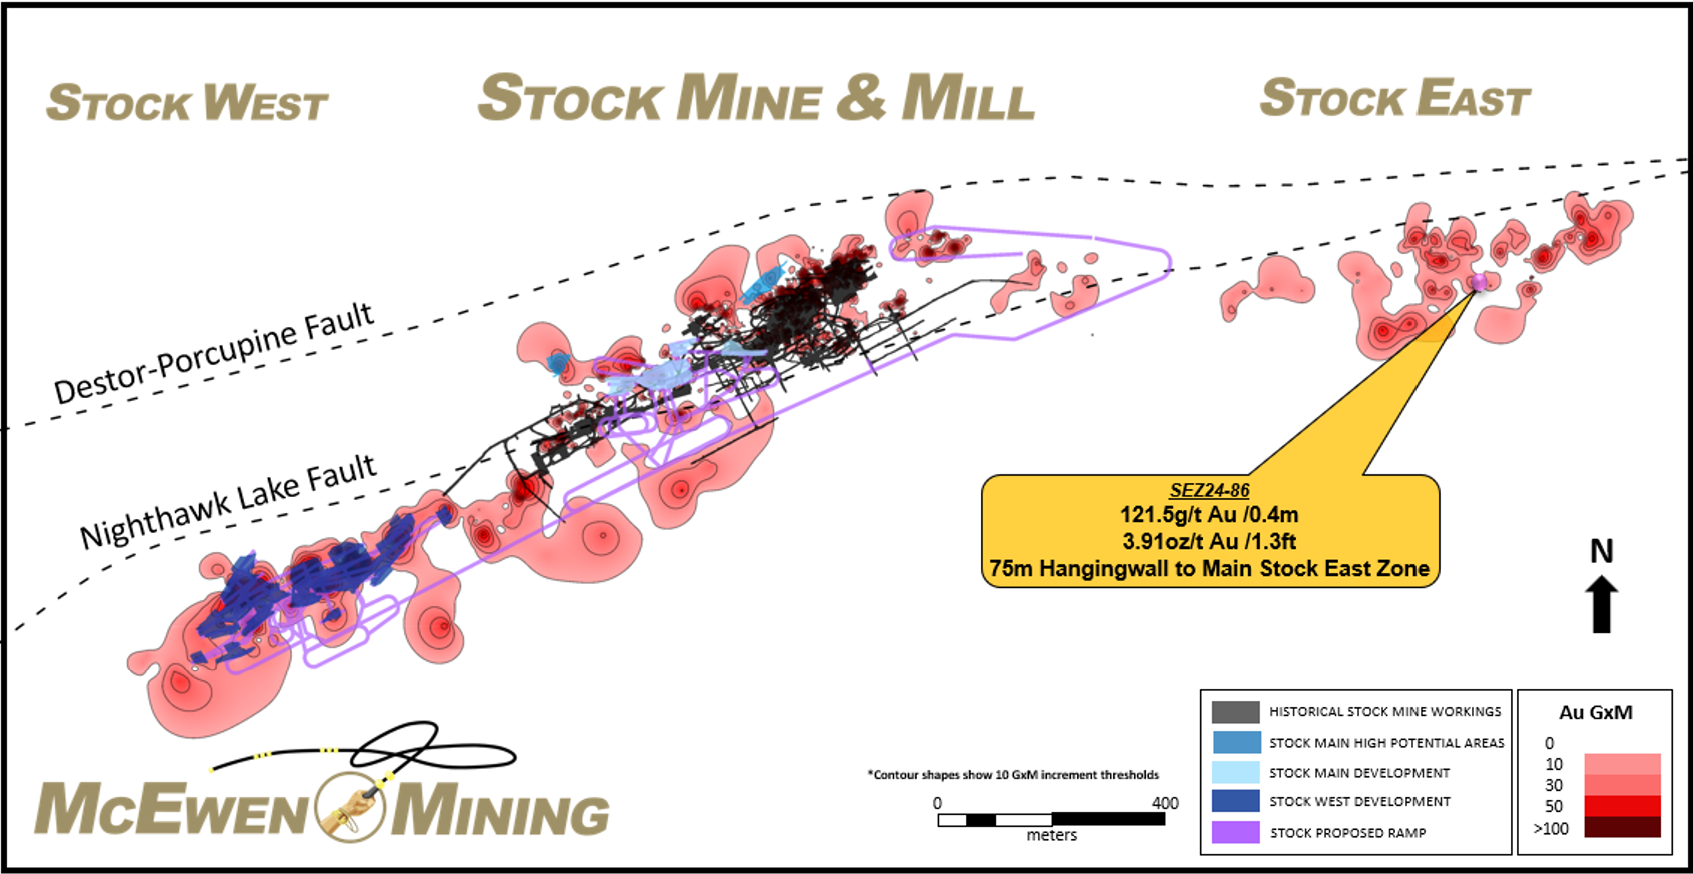
Figure 3: Longitudinal section looking North - Stock East Zone: 2023 & 2024 drill results shown in yellow
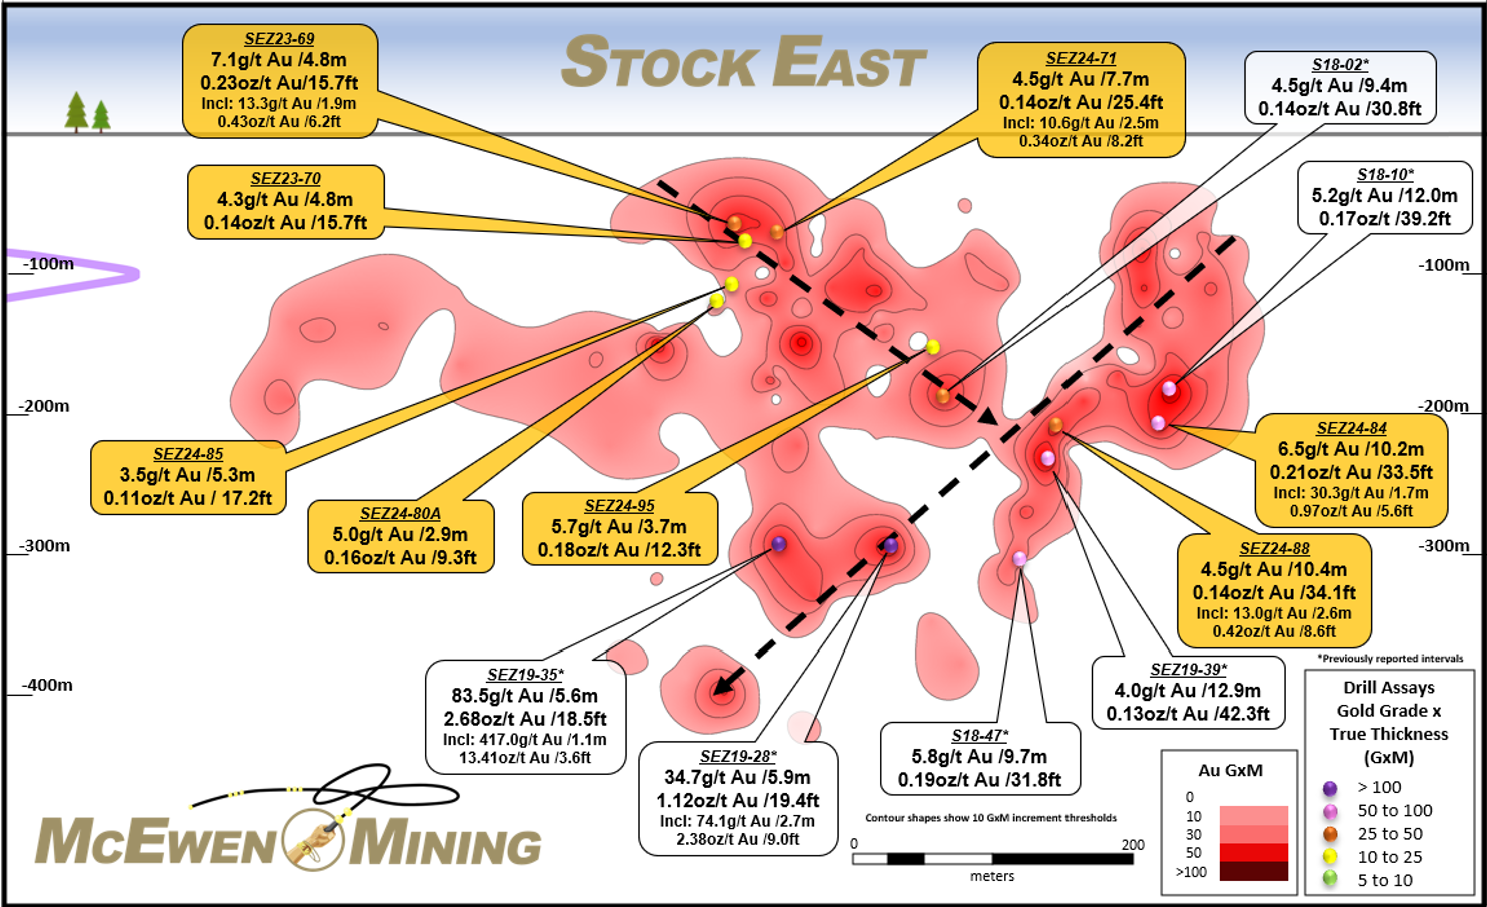
Most of the assay results from Stock East shown in Fig 3. represent true widths of over 4 m with good grades, and there is sound geological continuity between the drillholes. The outline of this zone is well defined and geological interpretations indicate a dip of about 70 degrees to the SE. Stock East has a strike length of approximately 400 meters, it extends vertically from near surface to a depth of at least 350 m and is open down-dip and to the East. The two proposed conjugate structural plunge directions (see Fig. 3, dashed lines) appear to be consistent with geological interpretations for the mineralization seen at Stock East and to provide excellent targeting vectors for future exploration and resource growth.
Table 1: Highlights of recent drill intercepts received for the Stock East zone
Hole ID | From (m) | To (m) | Core Length (m) | True Width (m) | Au (g/t) | Au (g/t) x TW (m) | Core Length (ft) | True Width (ft) | Au (oz/t) | Au (oz/t) x TW (ft) |
| SEZ23-69 | 80.40 | 87.70 | 7.30 | 4.78 | 7.11 | 33.96 | 23.95 | 15.68 | 0.23 | 3.58 |
| Including | 84.60 | 87.70 | 3.10 | 1.90 | 13.28 | 10.17 | 6.23 | 0.43 | ||
| SEZ23-70 | 86.65 | 93.74 | 7.09 | 4.80 | 4.27 | 20.47 | 23.26 | 15.74 | 0.14 | 2.16 |
| Including | 86.65 | 91.00 | 4.35 | 2.81 | 5.88 | 14.27 | 9.22 | 0.19 | ||
| SEZ23-71 | 80.55 | 90.00 | 9.45 | 7.74 | 4.51 | 34.91 | 31.00 | 25.39 | 0.14 | 3.68 |
| Including | 87.00 | 90.00 | 3.00 | 2.51 | 10.64 | 9.84 | 8.24 | 0.34 | ||
| SEZ24-80A | 139.65 | 143.50 | 3.85 | 2.85 | 4.96 | 14.13 | 12.63 | 9.34 | 0.16 | 1.49 |
| SEZ24-84 | 212.64 | 229.00 | 16.36 | 10.22 | 6.45 | 65.92 | 53.67 | 33.53 | 0.21 | 6.95 |
| Including | 226.34 | 229.00 | 2.66 | 1.71 | 30.31 | 8.73 | 5.62 | 0.97 | ||
| SEZ24-85 | 133.59 | 140.00 | 6.41 | 5.25 | 3.49 | 18.32 | 21.03 | 17.24 | 0.11 | 1.93 |
| SEZ24-86 | 85.08 | 85.67 | 0.59 | 0.39 | 121.53 | 45.60 | 1.94 | 1.29 | 3.91 | 5.03 |
| SEZ24-88 | 226.00 | 241.84 | 15.84 | 10.36 | 4.48 | 46.41 | 51.97 | 33.99 | 0.14 | 4.90 |
| Including | 238.00 | 241.84 | 3.84 | 2.61 | 12.96 | 12.60 | 8.58 | 0.42 | ||
| SEZ24-95 | 202.54 | 207.77 | 5.23 | 3.74 | 5.69 | 21.28 | 17.16 | 12.27 | 0.18 | 2.24 |
| SEZ19-28* | 337.00 | 343.50 | 6.50 | 5.91 | 34.71 | 205.25 | 21.33 | 19.40 | 1.12 | 21.65 |
| Including | 339.80 | 342.80 | 3.00 | 2.73 | 74.13 | 9.84 | 8.96 | 2.38 | ||
| SEZ19-35* | 324.30 | 330.50 | 6.20 | 5.64 | 83.49 | 470.95 | 20.34 | 18.51 | 2.68 | 49.68 |
| Including | 325.30 | 326.50 | 1.20 | 1.09 | 417.00 | 3.94 | 3.58 | 13.41 | ||
| SEZ19-39* | 303.60 | 319.40 | 15.80 | 12.90 | 3.97 | 51.23 | 51.84 | 42.33 | 0.13 | 5.40 |
| Including | 304.30 | 305.00 | 0.70 | 0.54 | 10.25 | 2.30 | 1.76 | 0.33 | ||
| Including | 316.00 | 317.00 | 1.00 | 0.77 | 25.50 | 3.28 | 2.52 | 0.82 | ||
| S18-02* | 230.40 | 241.00 | 10.60 | 9.40 | 4.49 | 42.21 | 34.78 | 30.84 | 0.14 | 4.45 |
| Including | 233.40 | 234.00 | 0.60 | 0.53 | 15.90 | 1.97 | 1.74 | 0.51 | ||
| S18-10* | 204.00 | 218.80 | 14.80 | 11.96 | 5.24 | 62.67 | 48.56 | 39.24 | 0.17 | 6.61 |
| Including | 215.80 | 217.80 | 2.00 | 1.62 | 26.53 | 6.56 | 5.31 | 0.85 | ||
| S18-47* | 335.70 | 348.00 | 12.30 | 9.69 | 5.76 | 55.81 | 40.35 | 31.79 | 0.19 | 5.89 |
| Including | 344.45 | 347.10 | 2.65 | 2.09 | 25.16 | 8.69 | 6.86 | 0.81 | ||
| Grades are presented uncapped; * - previously reported intervals. | ||||||||||
Table 2: Comparison of the Stock West and Main resource beginning with the 2022 PEA
| Classification | Quantity '000 t | Change | Gold Grade | Change | Contained Metal | Change | ||||
| % | g/t | % | '000 oz Au | % | ||||||
| 2022 PEA | Indicated | 1,171 | 3.83 | 144 | ||||||
| Inferred | 1,049 | 3.30 | 111 | |||||||
| Year-End 2022 | Indicated | 1,280 | +9% | 3.66 | -4% | 151 | +5% | |||
| Inferred | 1,041 | -1% | 3.20 | -3% | 107 | -4% | ||||
| Year-End 2023** | Indicated | 1,938 | +51% | 3.31 | -10% | 206 | +37% | |||
| Inferred | 1,386 | +33% | 2.96 | -8% | 132 | +23% | ||||
** Mineral resources are not mineral reserves and do not have demonstrated economic viability. All figures are rounded to reflect the relative accuracy of the estimates. For this update, an additional 272 drillholes (100,834 m) were added to the database since the last resource update in December 2022. Composites were capped where appropriate. Mineral resources are reported at a cut-off grade of 1.95 g/t gold, demonstrate Reasonable Prospects of Eventual Economic Extraction assuming an underground extraction scenario, being constrained by MSO stope shapes, a gold price of US $1,725 per ounce, and a metallurgical recovery of 94 percent.
This resource statement does not include the Stock East deposit, which had its own mineral resource estimation updated in March 2022; there is a separate Mineral Resource Statement for Stock East.
Technical information
Technical information pertaining to the Fox Complex exploration contained in this news release has been prepared under the supervision of Sean Farrell, P.Geo., Chief Exploration Geologist, who is a Qualified Person as defined by Canadian Securities Administrators National Instrument 43-101 "Standards of Disclosure for Mineral Projects."
The technical information related to resource and reserve estimates in this news release has been reviewed and approved by Luke Willis, P.Geo., McEwen Mining’s Director of Resource Modelling and Qualified Person as defined by SEC S-K 1300 and Canadian Securities Administrators National Instrument 43-101 "Standards of Disclosure for Mineral Projects."
Exploration drill core samples at the Stock Complex were typically submitted as 1/2 core. Analyses reported herein were either performed by the fire assay method at the accredited laboratory Pangea Laboratorio in Sinaloa, Mexico, owned and operated by an indirect subsidiary of the Company (NMX-EC-17025-IMNC-2018, ISO /IEC 17025:2017), or by the photon assay method at the accredited laboratory MSA Labs in Timmins, Ontario, Canada (ISO 9001 & ISO 10725).
For a list of drilling results at Stock since June 2, 2023, including hole location and alignment, click here:
https://www.mcewenmining.com/files/doc_news/archive/2024/2024_02_StockDrillResults.xlsx
CAUTION CONCERNING FORWARD-LOOKING STATEMENTS
This news release contains certain forward-looking statements and information, including "forward-looking statements" within the meaning of the Private Securities Litigation Reform Act of 1995. The forward-looking statements and information expressed, as at the date of this news release, McEwen Mining Inc.’s (the "Company") estimates, forecasts, projections, expectations or beliefs as to future events and results. Forward-looking statements and information are necessarily based upon a number of estimates and assumptions that, while considered reasonable by management, are inherently subject to significant business, economic and competitive uncertainties, risks and contingencies, and there can be no assurance that such statements and information will prove to be accurate. Therefore, actual results and future events could differ materially from those anticipated in such statements and information. Risks and uncertainties that could cause results or future events to differ materially from current expectations expressed or implied by the forward-looking statements and information include, but are not limited to, effects of the COVID-19 pandemic, fluctuations in the market price of precious metals, mining industry risks, political, economic, social and security risks associated with foreign operations, the ability of the corporation to receive or receive in a timely manner permits or other approvals required in connection with operations, risks associated with the construction of mining operations and commencement of production and the projected costs thereof, risks related to litigation, the state of the capital markets, environmental risks and hazards, uncertainty as to calculation of mineral resources and reserves, and other risks. Readers should not place undue reliance on forward-looking statements or information included herein, which speak only as of the date hereof. The Company undertakes no obligation to reissue or update forward-looking statements or information as a result of new information or events after the date hereof except as may be required by law. See McEwen Mining’s Annual Report on Form 10-K for the fiscal year ended December 31, 2022, and other filings with the Securities and Exchange Commission, under the caption "Risk Factors", for additional information on risks, uncertainties and other factors relating to the forward-looking statements and information regarding the Company. All forward-looking statements and information made in this news release are qualified by this cautionary statement.
The NYSE and TSX have not reviewed and do not accept responsibility for the adequacy or accuracy of the contents of this news release, which has been prepared by management of McEwen Mining Inc.
ABOUT MCEWEN MINING
McEwen Mining is a gold and silver producer with operations in Nevada, Canada, Mexico and Argentina. In addition, it owns approximately 47.7% of McEwen Copper which owns the large, advanced-stage Los Azules copper project in Argentina. Rob McEwen, Chairman and Chief Owner, has a personal investment in the company of US$220 million. His annual salary is US$1.
Want News Fast?
Subscribe to our email list by clicking here:
https://www.mcewenmining.com/contact-us/#section=followUs
and receive news as it happens!
| WEB SITE | SOCIAL MEDIA | |||||
| www.mcewenmining.com | McEwen Mining | Facebook: | facebook.com/mcewenmining | |||
| LinkedIn: | linkedin.com/company/mcewen-mining-inc- | |||||
| CONTACT INFORMATION | Twitter: | twitter.com/mcewenmining | ||||
| 150 King Street West | Instagram: | instagram.com/mcewenmining | ||||
| Suite 2800, PO Box 24 | ||||||
| Toronto, ON, Canada | McEwen Copper | Facebook: | facebook.com/ mcewencopper | |||
| M5H 1J9 | LinkedIn: | linkedin.com/company/mcewencopper | ||||
| Twitter: | twitter.com/mcewencopper | |||||
| Relationship with Investors: | Instagram: | instagram.com/mcewencopper | ||||
| (866)-441-0690 - Toll free line | ||||||
| (647)-258-0395 | Rob McEwen | Facebook: | facebook.com/mcewenrob | |||
| Mihaela Iancu ext. 320 | LinkedIn: | linkedin.com/in/robert-mcewen-646ab24 | ||||
| info@mcewenmining.com | Twitter: | twitter.com/robmcewenmux | ||||
A photo accompanying this announcement is available at:
https://www.globenewswire.com/NewsRoom/AttachmentNg/5a77353f-7e14-4df0-8b0b-69000806b355
https://www.globenewswire.com/NewsRoom/AttachmentNg/e3a4ebe6-3bd8-4b0b-a8dd-a15b91218334
https://www.globenewswire.com/NewsRoom/AttachmentNg/df3902f4-4e4d-4c33-b5b3-3c69a1f7ca16

![]()