As markets come to a significant turning point, investors can benefit from understanding where money has been and where it may be going into, as pivots in the flow of investment preferences usually give a window of opportunity for those who can spot it. In today's environment, some instruments and indicators give out 'warning' signs, causing broader allocators to rotate their portfolios to maneuver around changing tides.
Smaller investors can implement reactive risk management on their portfolios as these rotations occur in the business cycle.
Specific trends and preferences show themselves by breaking up the holdings into the outperforming and underperforming sectors in U.S. equities. Companies within the VanEck Semiconductor ETF (NASDAQ: SMH), as well as those within the iShares U.S. Home Construction ETF (BATS: ITB), have blown past the majority of the remaining sectors in the economy, outperforming by as much as 58% during the past twelve months.
On the opposite end of the spectrum, markets can find the Vanguard Real Estate ETF (NYSEARCA: VNQ) alongside the VanEck Agribusiness ETF (NYSEARCA: MOO) underperforming by as much as 4.5% during the comparable past twelve months. By studying today's business cycle, investors will find the reasoning behind these preferences and where they may go next.
Where the Wind Blows
As the global COVID-19 pandemic pushed its effects onto the U.S. economy, the FED was forced to counteract with drastic measures, mainly injecting liquidity into financial markets while lowering interest rates to accommodate consumption and stimulate financing. Now that the wind is turning, inflation ran rampant, and sure, disconnects became more considerable in the economy, pushing the FED onto the opposite end of its policy and raising rates to tame a heating economy.
These significant moves typically prompt money managers and large allocators to rotate their portfolios, and today's cycle proves what is working and what isn't.
Industries like semiconductors and construction rely heavily on financing and ample economic liquidity, boosting underlying product demand and consumer activity. The outperformance in both sectors is due to investors preferring these 'cycle sensitive' niches while leaving behind some of the more 'defensive' or non-sensitive sectors like agriculture and REITs (Real Estate Investment Trusts).
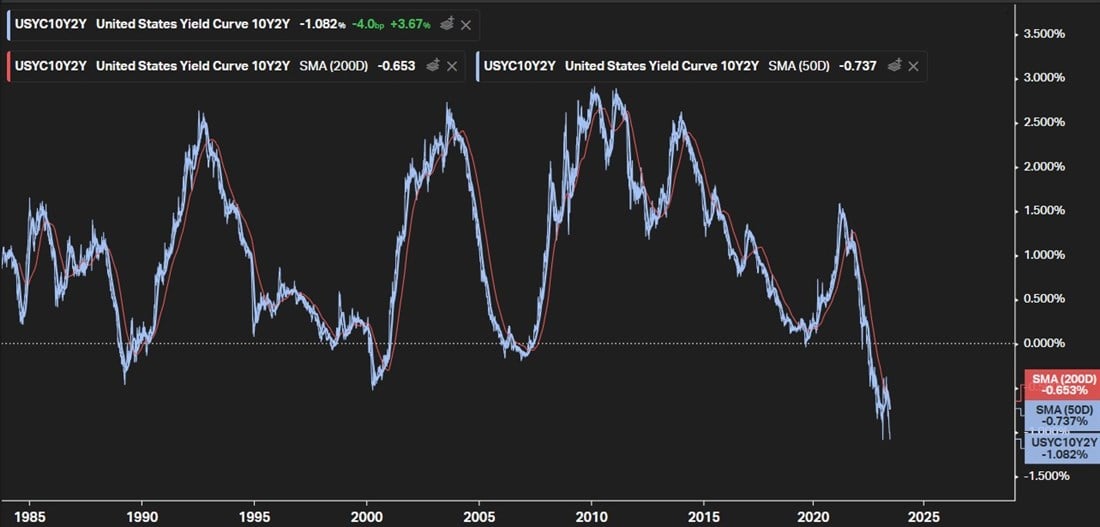
The United States yield curve, measured as the 10-year treasury yield minus the 2-year treasury yield, is a reliable measure of perceived liquidity in financial markets. Today's curve tests inversion levels never seen before (an 'inverted' yield curve occurs when the 2-year yield is higher than the 10-year yield). Historically, the more inverted the yield curve becomes, the more bearish the future outlooks are for the economy.
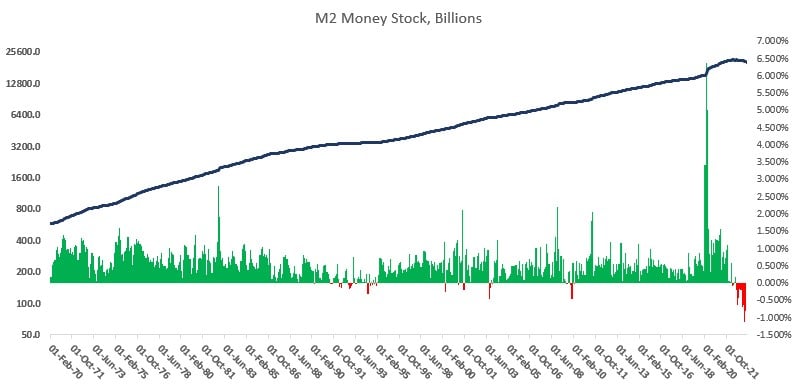
The current yield curve inversion, which can be noted by the blue line chart falling below the 0% mark, comes at a time when the economy’s money supply saw its largest monthly decline. As seen in the bar chart below the actual M2 supply monthly level moves, the M2 money supply declined by its largest rate since the financial crisis of 2008.
While the FED has successfully lowered the inflation rate in the economy, the consequences are beginning to be priced into the equities market by overall investors.
Next Stop
Understanding that companies like NVIDIA (NASDAQ: NVDA) and D.R. Horton (NYSE: DHI) have significantly outperformed both markets and peers, investors can see how these moves came from previous economic conditions. Now that liquidity is beginning to dry up and tradeable assets like bonds are giving signs of increased concerns via the yield curve, markets will likely rotate into the opposite end of past performance to seek safety and returns.
Companies like Tyson Foods (NYSE: TSN), a large capitalization consumer defensive company, are trading at a deep discount to previous highs due to these trends.
Similarly, a real estate giant like Essex Property Trust (NYSE: ESS) has seen its stock beaten down for several months. Now that investors will be looking for more stable, defensive cash flows, Essex can be another undervalued name that can promise safety. Perhaps Essex analyst ratings remain cautious, as these targets only allow for a 3.5% upside from today's prices. However, a historically low P/E ratio in the stock says otherwise.
Similarly, Tyson Foods analyst ratings are only pointing the stock going to a fraction of the highs seen during 2021-2022, raising the question as to whether this rotation's start will be the tipping point for upgrades.