

Financial services giant Prudential Financial (NYSE: PRU) beat Wall Street’s revenue expectations in Q3 CY2025, but sales fell by 16.7% year on year to $16.24 billion. Its non-GAAP profit of $4.26 per share was 14.5% above analysts’ consensus estimates.
Is now the time to buy Prudential? Find out by accessing our full research report, it’s free for active Edge members.
Prudential (PRU) Q3 CY2025 Highlights:
- Net Premiums Earned: $8.69 billion vs analyst estimates of $6.73 billion (38.6% year-on-year decline, 29.2% beat)
- Revenue: $16.24 billion vs analyst estimates of $14.19 billion (16.7% year-on-year decline, 14.4% beat)
- Pre-tax Profit: $1.78 billion (11% margin, 202% year-on-year growth)
- Adjusted EPS: $4.26 vs analyst estimates of $3.72 (14.5% beat)
- Book Value per Share: $90.69 vs analyst estimates of $98.89 (6.1% year-on-year growth, 8.3% miss)
- Market Capitalization: $35.7 billion
Company Overview
Recognized by its iconic Rock of Gibraltar logo symbolizing strength and stability since 1896, Prudential Financial (NYSE: PRU) provides life insurance, annuities, retirement solutions, investment management, and other financial services to individual and institutional customers globally.
Revenue Growth
Big picture, insurers generate revenue from three key sources. The first is the core business of underwriting policies. The second source is income from investing the “float” (premiums collected upfront not yet paid out as claims) in assets such as fixed-income assets and equities. The third is fees from various sources such as policy administration, annuities, or other value-added services. Unfortunately, Prudential struggled to consistently increase demand as its $56.17 billion of revenue for the trailing 12 months was close to its revenue five years ago. This was below our standards and is a sign of poor business quality.
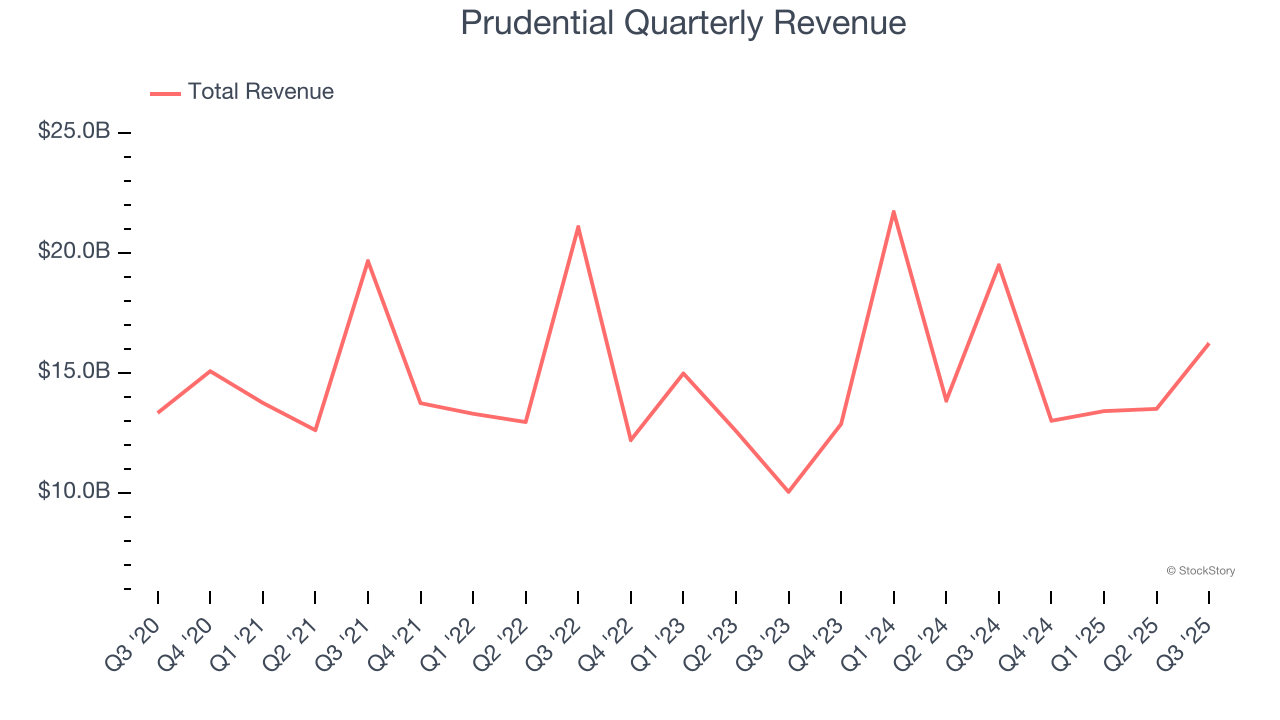
Long-term growth is the most important, but within financials, a half-decade historical view may miss recent interest rate changes and market returns. Prudential’s annualized revenue growth of 6.2% over the last two years is above its five-year trend, but we were still disappointed by the results. 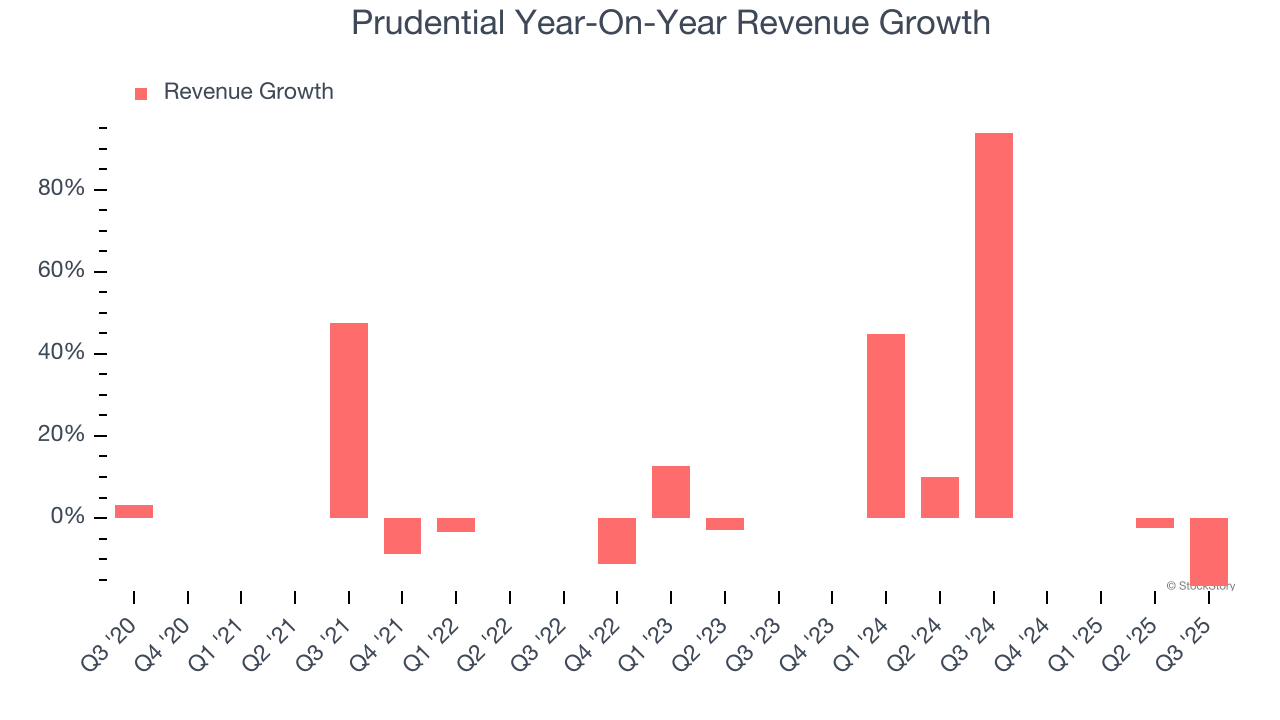 Note: Quarters not shown were determined to be outliers, impacted by outsized investment gains/losses that are not indicative of the recurring fundamentals of the business.
This quarter, Prudential’s revenue fell by 16.7% year on year to $16.24 billion but beat Wall Street’s estimates by 14.4%.
Net premiums earned made up 66.2% of the company’s total revenue during the last five years, meaning insurance operations are Prudential’s largest source of revenue.
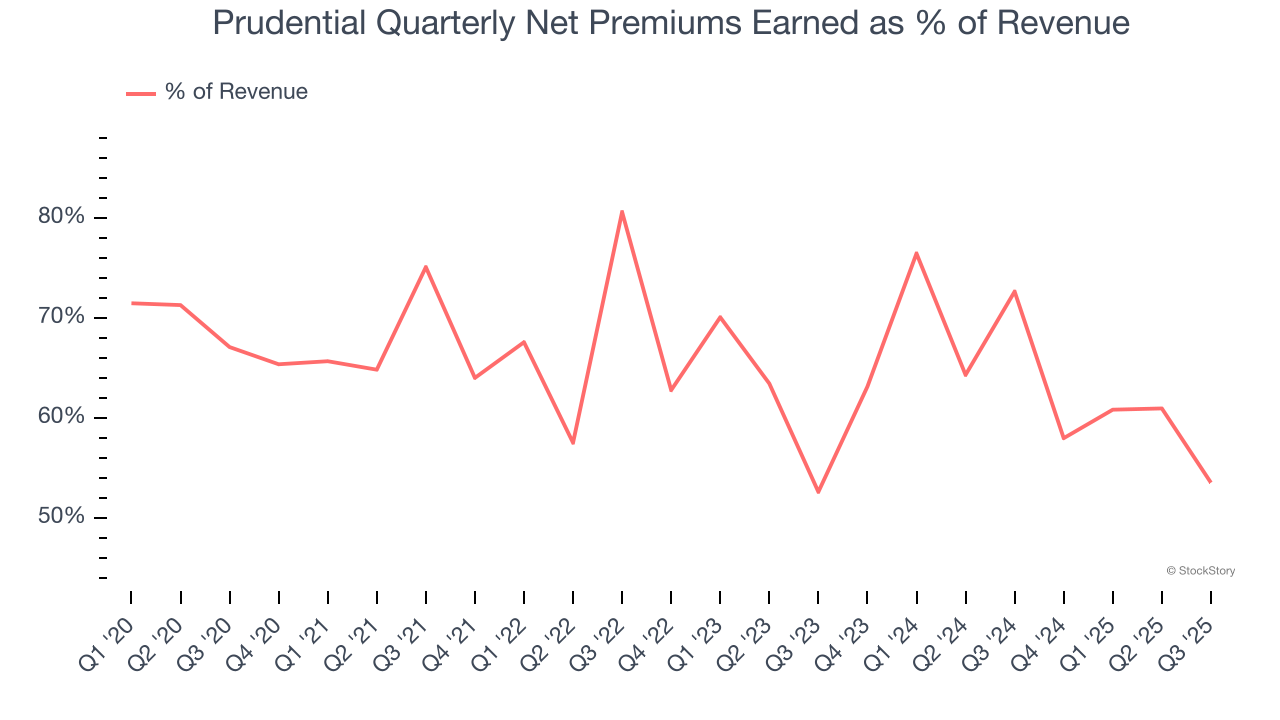
Our experience and research show the market cares primarily about an insurer’s net premiums earned growth as investment and fee income are considered more susceptible to market volatility and economic cycles.
Here at StockStory, we certainly understand the potential of thematic investing. Diverse winners from Microsoft (MSFT) to Alphabet (GOOG), Coca-Cola (KO) to Monster Beverage (MNST) could all have been identified as promising growth stories with a megatrend driving the growth. So, in that spirit, we’ve identified a relatively under-the-radar profitable growth stock benefiting from the rise of AI, available to you FREE via this link.
Book Value Per Share (BVPS)
Insurers are balance sheet businesses, collecting premiums upfront and paying out claims over time. Premiums collected but not yet paid out, often referred to as the float, are invested and create an asset base supported by a liability structure. Book value per share (BVPS) captures this dynamic by measuring these assets (investment portfolio, cash, reinsurance recoverables) less liabilities (claim reserves, debt, future policy benefits). BVPS is essentially the residual value for shareholders.
We therefore consider BVPS very important to track for insurers and a metric that sheds light on business quality. While other (and more commonly known) per-share metrics like EPS can sometimes be lumpy due to reserve releases or one-time items and can be managed or skewed while still following accounting rules, BVPS reflects long-term capital growth and is harder to manipulate.
Prudential’s BVPS declined at a 11.5% annual clip over the last five years. However, BVPS growth has accelerated recently, growing by 12.7% annually over the last two years from $71.44 to $90.69 per share.
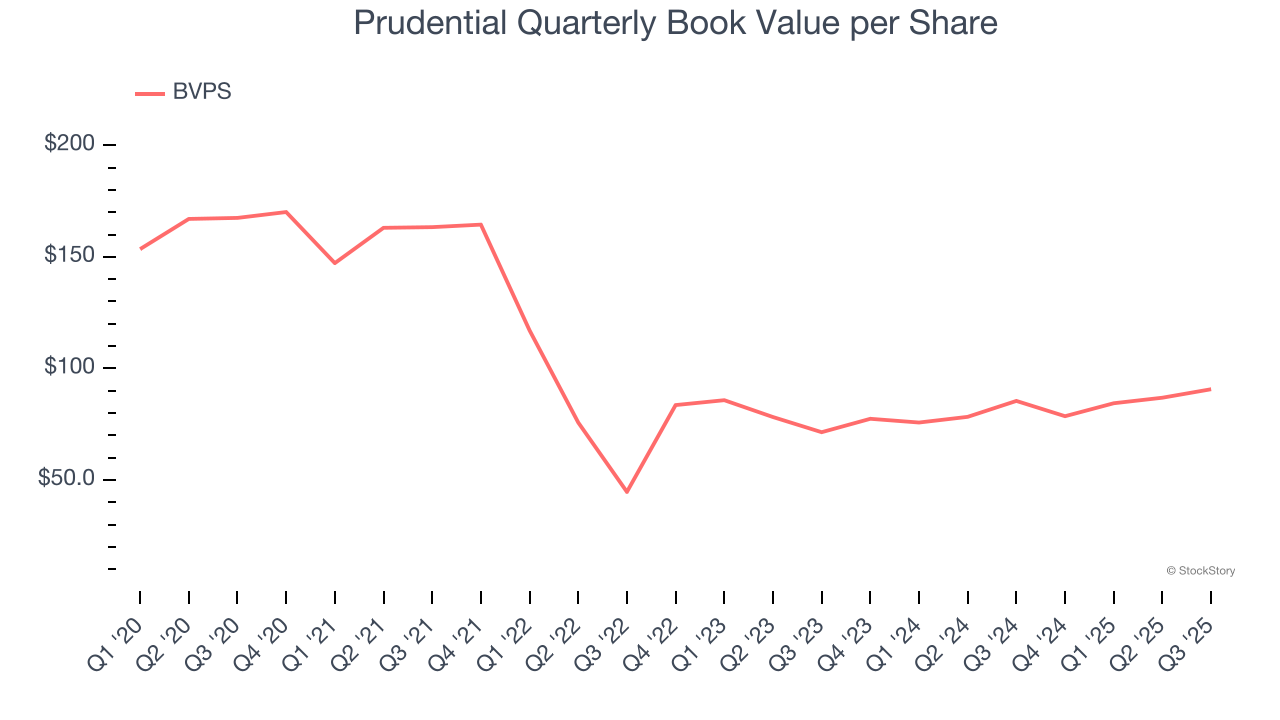
Over the next 12 months, Consensus estimates call for Prudential’s BVPS to grow by 16.6% to $98.89, top-notch growth rate.
Key Takeaways from Prudential’s Q3 Results
We were impressed by how significantly Prudential blew past analysts’ net premiums earned expectations this quarter. We were also excited its revenue outperformed Wall Street’s estimates by a wide margin. On the other hand, its book value per share missed. Overall, this print had some key positives. The stock traded up 1.5% to $102.75 immediately following the results.
Prudential had an encouraging quarter, but one earnings result doesn’t necessarily make the stock a buy. Let’s see if this is a good investment. If you’re making that decision, you should consider the bigger picture of valuation, business qualities, as well as the latest earnings. We cover that in our actionable full research report which you can read here, it’s free for active Edge members.


