

Wrapping up Q3 earnings, we look at the numbers and key takeaways for the financial exchanges & data stocks, including CME Group (NASDAQ: CME) and its peers.
Financial exchanges and data providers operate trading platforms and sell market information. They enjoy relatively stable revenue from trading fees and subscriptions, increasing demand for data analytics, and expansion opportunities in emerging markets. Challenges include regulatory oversight of market structure, competition from alternative trading venues, and substantial technology investments needed to maintain low-latency trading infrastructure and data security.
The 10 financial exchanges & data stocks we track reported a satisfactory Q3. As a group, revenues beat analysts’ consensus estimates by 0.9%.
In light of this news, share prices of the companies have held steady. On average, they are relatively unchanged since the latest earnings results.
CME Group (NASDAQ: CME)
Born from the Chicago Mercantile Exchange founded in 1898 as a butter and egg trading venue, CME Group (NASDAQ: CME) operates the world's largest derivatives marketplace where traders can buy and sell futures and options contracts across interest rates, equities, currencies, commodities, and more.
CME Group reported revenues of $1.54 billion, down 3% year on year. This print was in line with analysts’ expectations, but overall, it was a mixed quarter for the company with a narrow beat of analysts’ EBITDA estimates but revenue in line with analysts’ estimates.
"Global clients continued relying on CME Group markets across all asset classes as they sought to navigate risk and pursue opportunities amid ongoing uncertainty in Q3," said Terry Duffy, Chairman and Chief Executive Officer, CME Group.
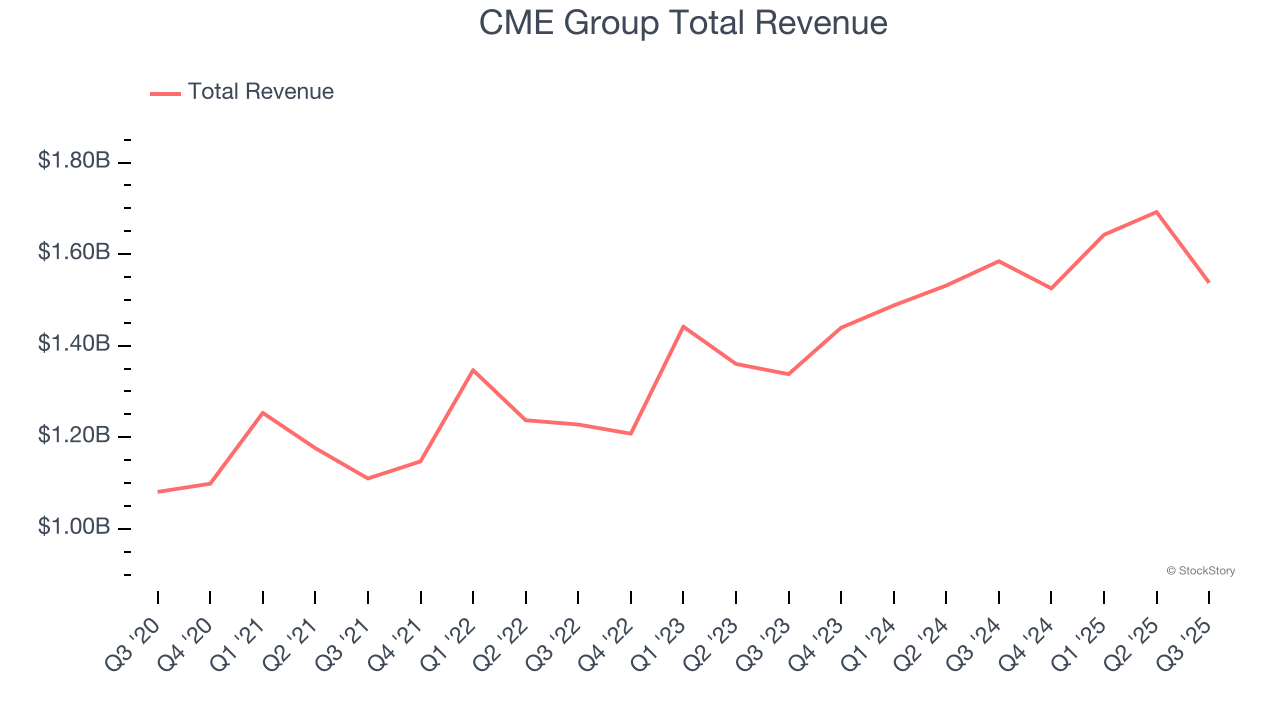
CME Group delivered the slowest revenue growth of the whole group. Interestingly, the stock is up 4.2% since reporting and currently trades at $280.01.
Is now the time to buy CME Group? Access our full analysis of the earnings results here, it’s free for active Edge members.
Best Q3: Moody's (NYSE: MCO)
Founded in 1900 during America's railroad boom when investors needed reliable information on bond risks, Moody's (NYSE: MCO) provides credit ratings, risk assessment tools, and analytical solutions that help organizations evaluate financial risks and make informed investment decisions.
Moody's reported revenues of $2.01 billion, up 10.7% year on year, outperforming analysts’ expectations by 2.4%. The business had a very strong quarter with a solid beat of analysts’ Investor Services segment estimates and an impressive beat of analysts’ EBITDA estimates.
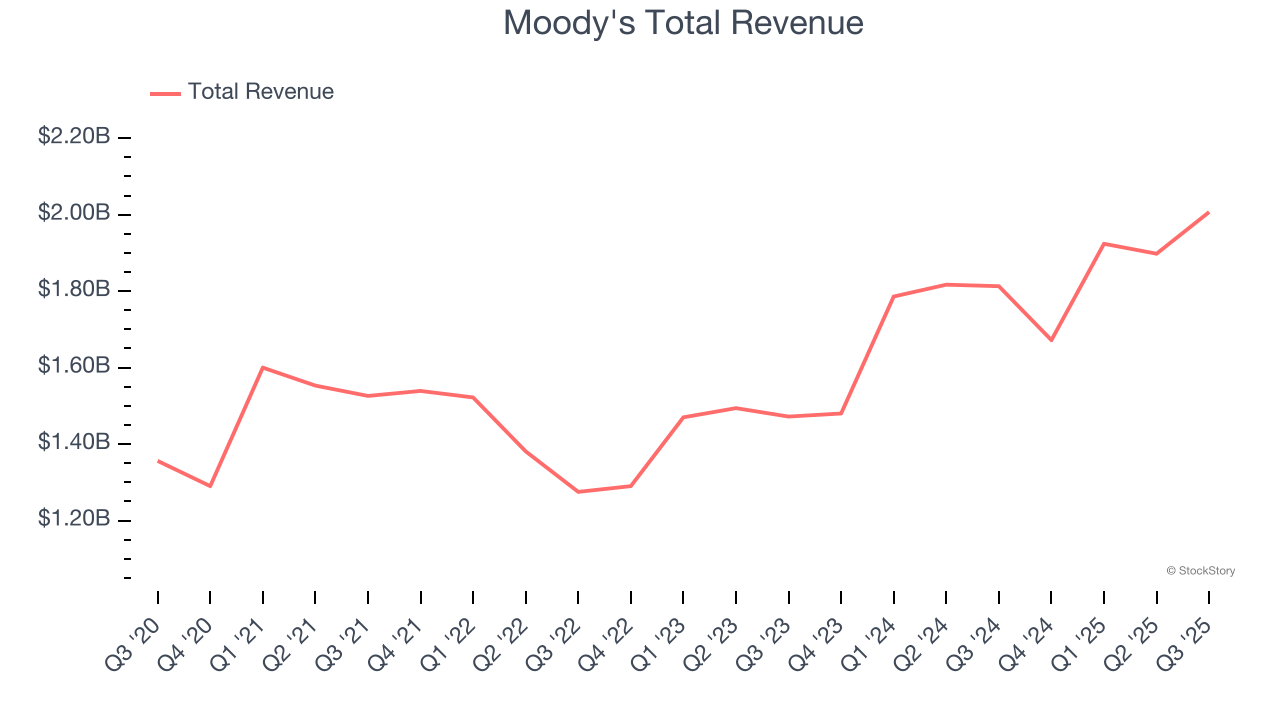
Moody's pulled off the biggest analyst estimates beat among its peers. However, the results were likely priced into the stock as it’s traded sideways since reporting. Shares currently sit at $487.13.
Is now the time to buy Moody's? Access our full analysis of the earnings results here, it’s free for active Edge members.
Weakest Q3: FactSet (NYSE: FDS)
Founded in 1978 when financial data was still primarily delivered through paper reports, FactSet (NYSE: FDS) provides financial data, analytics, and technology solutions that investment professionals use to research, analyze, and manage their portfolios.
FactSet reported revenues of $596.9 million, up 6.2% year on year, exceeding analysts’ expectations by 0.6%. Still, it was a slower quarter as it posted full-year EPS guidance meeting analysts’ expectations and a significant miss of analysts’ EPS estimates.
As expected, the stock is down 17.6% since the results and currently trades at $276.99.
Read our full analysis of FactSet’s results here.
Tradeweb Markets (NASDAQ: TW)
Founded in 1996 as one of the pioneers in electronic bond trading, Tradeweb Markets (NASDAQ: TW) builds and operates electronic marketplaces that connect financial institutions for trading across rates, credit, equities, and money markets.
Tradeweb Markets reported revenues of $508.6 million, up 13.3% year on year. This number surpassed analysts’ expectations by 1%. Taking a step back, it was a slower quarter as it produced a significant miss of analysts’ EPS estimates and transaction volumes in line with analysts’ estimates.
Tradeweb Markets achieved the fastest revenue growth among its peers. The stock is up 2.4% since reporting and currently trades at $107.92.
Read our full, actionable report on Tradeweb Markets here, it’s free for active Edge members.
S&P Global (NYSE: SPGI)
Tracing its roots back to 1860 when it published the first railroad industry manual, S&P Global (NYSE: SPGI) provides credit ratings, market intelligence, commodity data, automotive analytics, and financial indices that help investors and businesses make decisions.
S&P Global reported revenues of $3.89 billion, up 8.8% year on year. This result beat analysts’ expectations by 1.1%. It was a strong quarter as it also logged a solid beat of analysts’ Ratings segment estimates and an impressive beat of analysts’ EBITDA estimates.
The stock is up 6.1% since reporting and currently trades at $502.
Read our full, actionable report on S&P Global here, it’s free for active Edge members.
Market Update
The Fed’s interest rate hikes throughout 2022 and 2023 have successfully cooled post-pandemic inflation, bringing it closer to the 2% target. Inflationary pressures have eased without tipping the economy into a recession, suggesting a soft landing. This stability, paired with recent rate cuts (0.5% in September 2024 and 0.25% in November 2024), fueled a strong year for the stock market in 2024. The markets surged further after Donald Trump’s presidential victory in November, with major indices reaching record highs in the days following the election. Still, questions remain about the direction of economic policy, as potential tariffs and corporate tax changes add uncertainty for 2025.
Want to invest in winners with rock-solid fundamentals? Check out our Top 6 Stocks and add them to your watchlist. These companies are poised for growth regardless of the political or macroeconomic climate.
StockStory’s analyst team — all seasoned professional investors — uses quantitative analysis and automation to deliver market-beating insights faster and with higher quality.


