
Business transformation services company Genpact (NYSE: G) reported Q3 CY2025 results topping the market’s revenue expectations, with sales up 6.6% year on year to $1.29 billion. Guidance for next quarter’s revenue was better than expected at $1.30 billion at the midpoint, 1.2% above analysts’ estimates. Its non-GAAP profit of $0.97 per share was 8% above analysts’ consensus estimates.
Is now the time to buy Genpact? Find out by accessing our full research report, it’s free for active Edge members.
Genpact (G) Q3 CY2025 Highlights:
- Revenue: $1.29 billion vs analyst estimates of $1.27 billion (6.6% year-on-year growth, 2% beat)
- Adjusted EPS: $0.97 vs analyst estimates of $0.90 (8% beat)
- Adjusted EBITDA: $222.1 million vs analyst estimates of $235.7 million (17.2% margin, 5.7% miss)
- Revenue Guidance for Q4 CY2025 is $1.30 billion at the midpoint, above analyst estimates of $1.29 billion
- Management raised its full-year Adjusted EPS guidance to $3.61 at the midpoint, a 1.7% increase
- Operating Margin: 14.8%, in line with the same quarter last year
- Free Cash Flow Margin: 22.6%, up from 17.2% in the same quarter last year
- Market Capitalization: $6.77 billion
Company Overview
Originally spun off from General Electric in 2005 to provide business process services, Genpact (NYSE: G) is a global professional services firm that helps businesses transform their operations through digital technology, AI, and data analytics solutions.
Revenue Growth
A company’s long-term sales performance is one signal of its overall quality. Even a bad business can shine for one or two quarters, but a top-tier one grows for years.
With $5.01 billion in revenue over the past 12 months, Genpact is one of the larger companies in the business services industry and benefits from a well-known brand that influences purchasing decisions.
As you can see below, Genpact’s sales grew at a decent 6.2% compounded annual growth rate over the last five years. This shows its offerings generated slightly more demand than the average business services company, a useful starting point for our analysis.
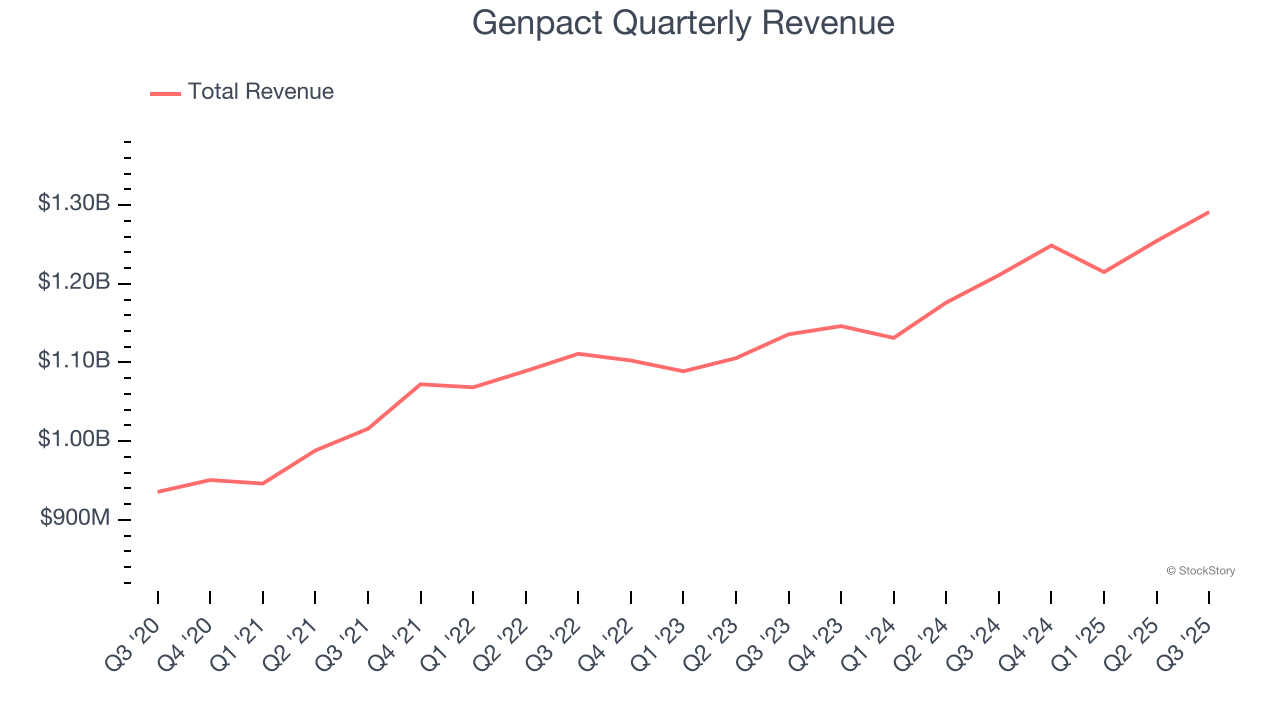
Long-term growth is the most important, but within business services, a half-decade historical view may miss new innovations or demand cycles. Genpact’s annualized revenue growth of 6.3% over the last two years aligns with its five-year trend, suggesting its demand was stable. 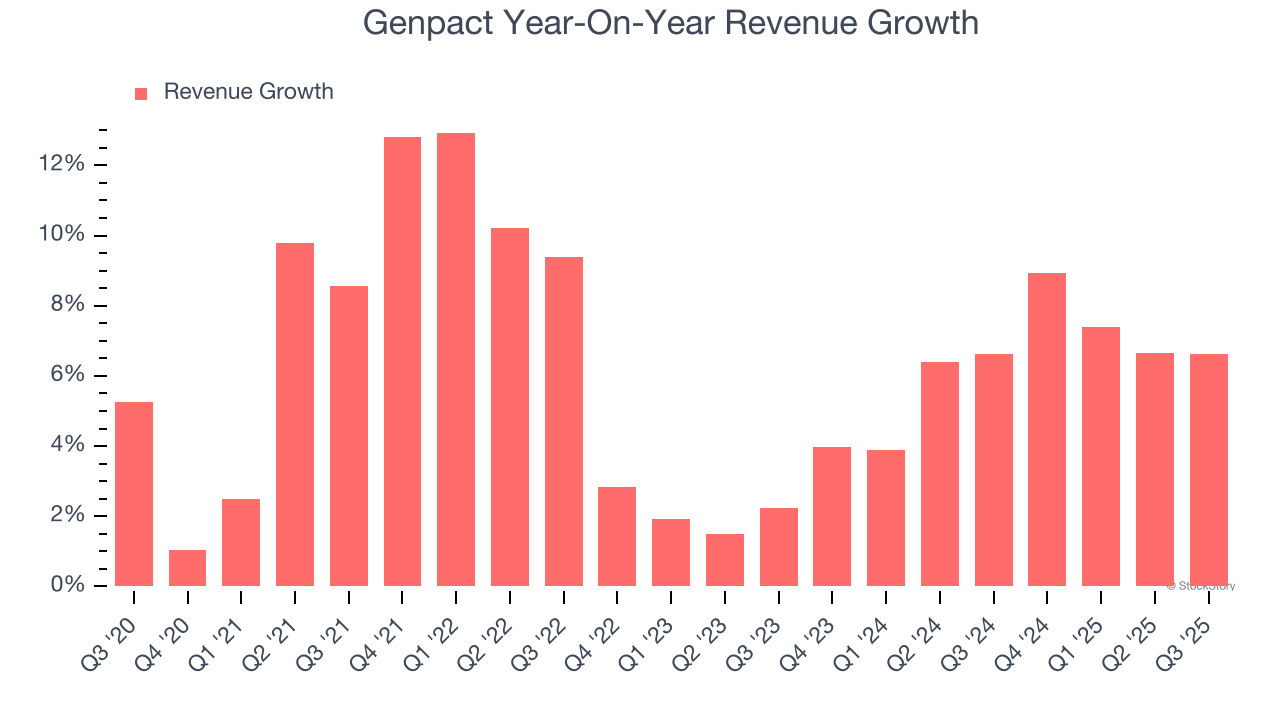
This quarter, Genpact reported year-on-year revenue growth of 6.6%, and its $1.29 billion of revenue exceeded Wall Street’s estimates by 2%. Company management is currently guiding for a 4.5% year-on-year increase in sales next quarter.
Looking further ahead, sell-side analysts expect revenue to grow 5.2% over the next 12 months, similar to its two-year rate. Despite the slowdown, this projection is above average for the sector and implies the market sees some success for its newer products and services.
Microsoft, Alphabet, Coca-Cola, Monster Beverage—all began as under-the-radar growth stories riding a massive trend. We’ve identified the next one: a profitable AI semiconductor play Wall Street is still overlooking. Go here for access to our full report.
Adjusted Operating Margin
Genpact’s adjusted operating margin might fluctuated slightly over the last 12 months but has generally stayed the same, averaging 16.8% over the last five years. This profitability was top-notch for a business services business, showing it’s an well-run company with an efficient cost structure.
Looking at the trend in its profitability, Genpact’s adjusted operating margin might fluctuated slightly but has generally stayed the same over the last five years. This raises questions about the company’s expense base because its revenue growth should have given it leverage on its fixed costs, resulting in better economies of scale and profitability.
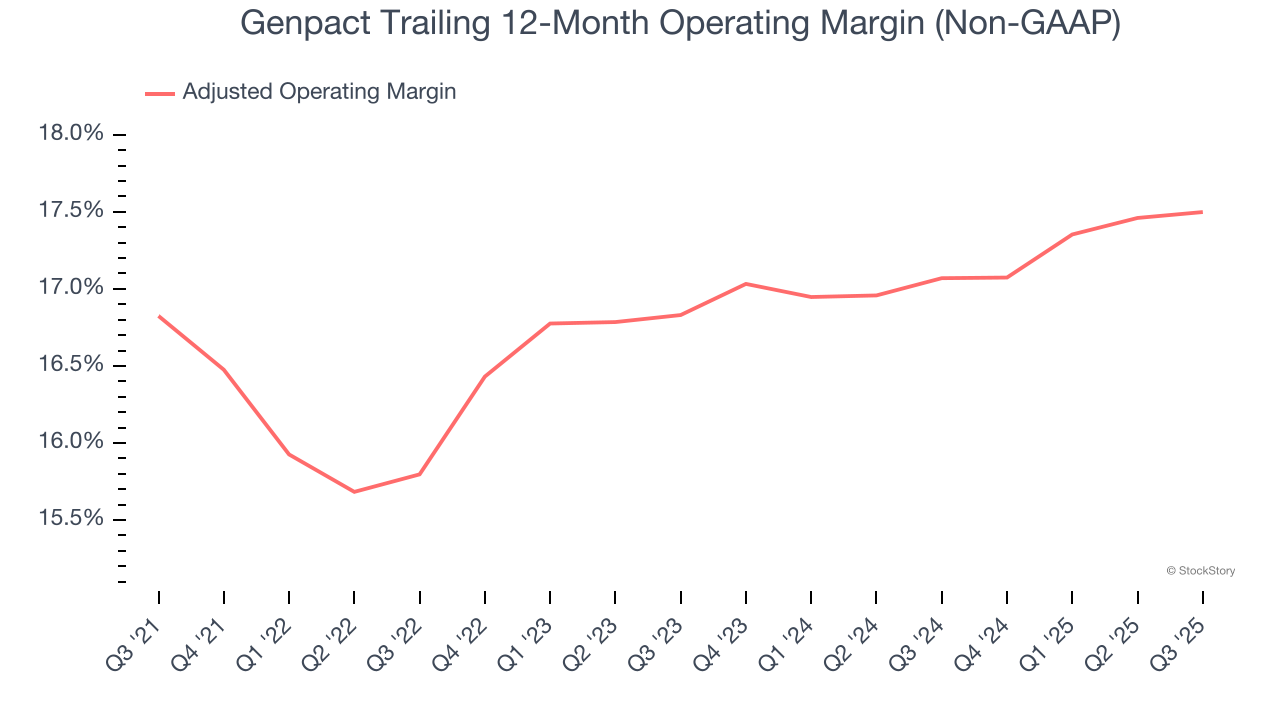
This quarter, Genpact generated an adjusted operating margin profit margin of 17.7%, in line with the same quarter last year. This indicates the company’s overall cost structure has been relatively stable.
Earnings Per Share
Revenue trends explain a company’s historical growth, but the long-term change in earnings per share (EPS) points to the profitability of that growth – for example, a company could inflate its sales through excessive spending on advertising and promotions.
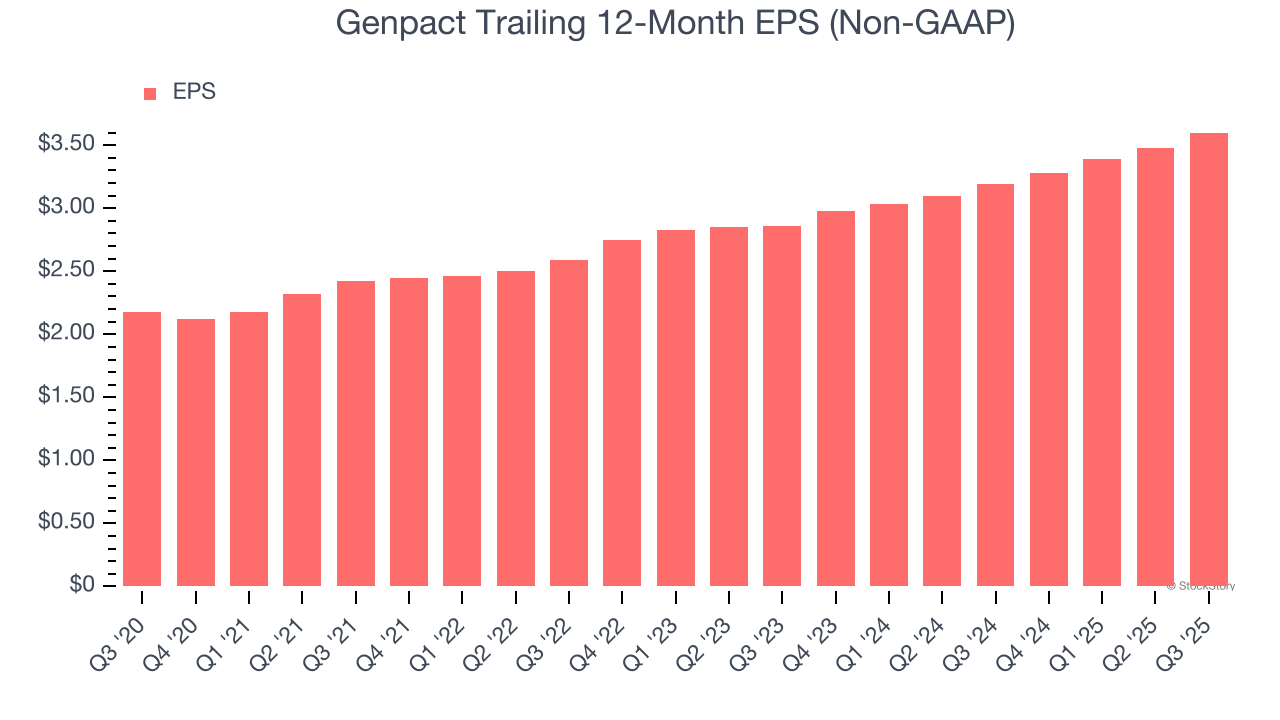
Genpact’s EPS grew at a remarkable 10.6% compounded annual growth rate over the last five years, higher than its 6.2% annualized revenue growth. However, this alone doesn’t tell us much about its business quality because its adjusted operating margin didn’t improve.
Like with revenue, we analyze EPS over a more recent period because it can provide insight into an emerging theme or development for the business.
For Genpact, its two-year annual EPS growth of 12.2% was higher than its five-year trend. We love it when earnings growth accelerates, especially when it accelerates off an already high base.
In Q3, Genpact reported adjusted EPS of $0.97, up from $0.85 in the same quarter last year. This print beat analysts’ estimates by 8%. Over the next 12 months, Wall Street expects Genpact’s full-year EPS of $3.60 to grow 4.7%.
Key Takeaways from Genpact’s Q3 Results
It was good to see Genpact beat analysts’ EPS expectations this quarter. We were also glad its revenue guidance for next quarter slightly exceeded Wall Street’s estimates. Overall, we think this was a decent quarter with some key metrics above expectations. The stock traded up 4.8% to $40.20 immediately after reporting.
Genpact may have had a good quarter, but does that mean you should invest right now? We think that the latest quarter is only one piece of the longer-term business quality puzzle. Quality, when combined with valuation, can help determine if the stock is a buy. We cover that in our actionable full research report which you can read here, it’s free for active Edge members.