Citigroup Inc. (C), based in New York City, stands out as a global financial powerhouse with operations in more than 160 countries and jurisdictions. Its wide-ranging services cover retail and commercial banking, credit cards, investment and wealth management, and treasury solutions, serving millions of customers worldwide. With a market capitalization of $182.47 billion, Citi navigates the world’s financial landscape by integrating technology and market expertise to offer seamless cross-border and local services.
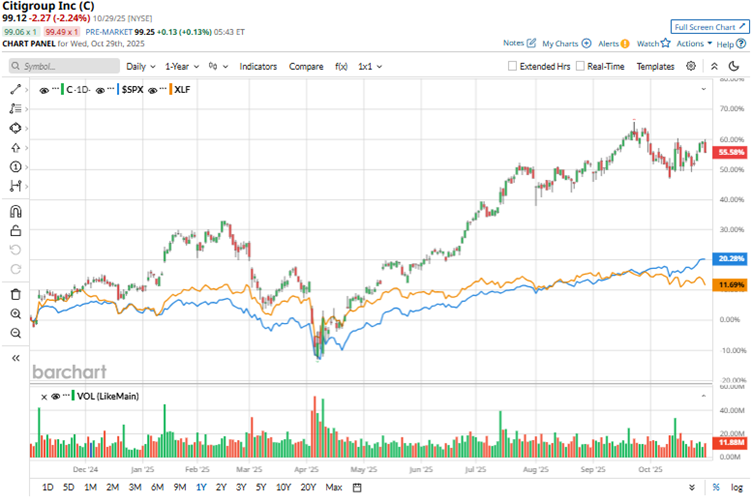
Citigroup’s stock has recorded robust gains over the past year, driven by strong financial performance, particularly increased investment banking activity, especially mergers and acquisitions, which boosted fee income. Over the past 52 weeks, the stock has gained 53.2%, while it is up 43.9% over the past six months. It has reached a 52-week high of $105.59 in September, but is down 6.1% from that level.
The stock has broadly outperformed the S&P 500 Index ($SPX), which has gained 18.1% and 23.9% over the same periods, respectively. Turning our focus to the sector-specific The Financial Select Sector SPDR Fund (XLF), we see that the ETF is up by 11% over the past 52 weeks and gained 7% over the past six months, thereby underperforming Citigroup’s stock.
On Oct. 14, Citigroup reported better-than-expected third-quarter results. The company recorded solid banking activity, particularly in investment banking, during the quarter. Citi’s revenue (net of interest expense) increased by 9% year-over-year (YOY) to $22.09 billion, which was higher than the $21.13 billion that Wall Street analysts had expected. Its EPS (adjusted for the goodwill impairment charge) was $2.24, up 48% from its year-ago value and above the expected $1.91. Citi’s stock climbed 3.9% intraday on the same day.
For the fiscal year 2025, ending in December 2025, Wall Street analysts expect Citigroup’s EPS to grow 32.3% YOY to $7.87 on a diluted basis, and increase by 25.2% to $9.85 in fiscal 2026. The company has a solid history of surpassing consensus estimates, topping them in all four trailing quarters.
Among the 25 Wall Street analysts covering Citigroup’s stock, the consensus is a “Moderate Buy.” That’s based on 12 “Strong Buy” ratings, four “Moderate Buys,” and nine “Hold” ratings. The ratings configuration is less bullish than it was two months ago, with 12 “Strong Buy” ratings now, down from 13 previously.
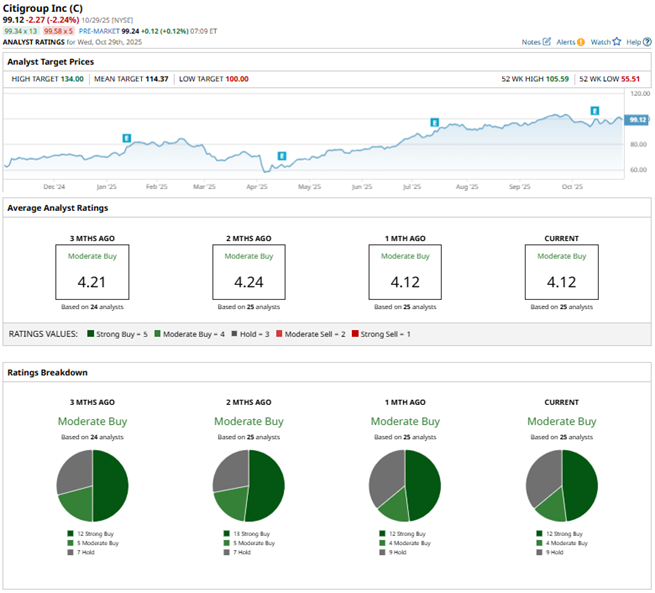
Based on the hotter-than-expected results in the third quarter, analysts at Keefe, Bruyette & Woods raised Citigroup’s stock price target from $112 to $118, while maintaining an “Outperform” rating on its shares. Moreover, Barclays analyst Jason Goldberg kept the stock’s “Overweight” rating and raised the price target from $100 to $115.
Citigroup’s mean price target of $114.37 indicates a 15.4% upside over current market prices. The Street-high price target of $134 implies a potential upside of 35.2%.
On the date of publication, Anushka Mukherjee did not have (either directly or indirectly) positions in any of the securities mentioned in this article. All information and data in this article is solely for informational purposes. For more information please view the Barchart Disclosure Policy here.
More news from Barchart
- Jensen Huang Says AI Is ‘Work,’ Not a ‘Tool.’ This 1 Blue-Chip Dividend Stock Is Bringing that Work to America
- A $9.5 Billion Reason to Buy This High-Performance Computing Stock
- This Data Center Stock Is Up 1,300% in Just 3 Years
- As Tesla Stock Disappoints on Earnings Yet Again, CEO Elon Musk Shares That This 1 Thing Is ‘His Biggest Concern’


