Denver, Colorado-based Newmont Corporation (NEM) is a mining company. It produces and explores gold, copper, silver, zinc, and lead with a primary focus on gold. With a market cap of $94.4 billion, Newmont’s operations span the Americas, Caribbean, Africa, and the Indo-Pacific.
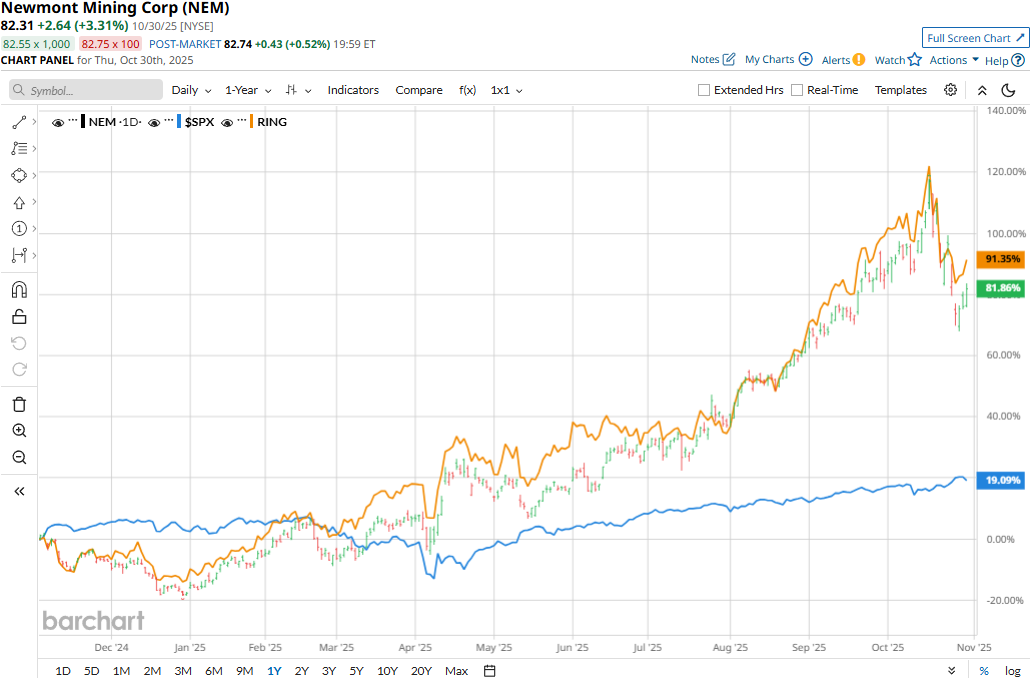
The mining giant has significantly outperformed the broader market over the past year and in 2025. NEM stock has soared 121.1% in 2025 and 75.4% over the past 52 weeks, outpacing the S&P 500 Index’s ($SPX) 16% gains on a YTD basis and 17.4% returns over the past year.
Narrowing the focus, Newmont has slightly lagged behind the industry-focused iShares Global Gold Miners ETF’s (RING) 121.2% surge in 2025 and 83.8% returns over the past year.
Despite delivering better-than-expected results, Newmont’s stock prices dropped 6.2% in the trading session following the release of its Q3 results on Oct. 23. Continuing its solid momentum in the quarter, Newmont’s sales for the quarter jumped nearly 20% year-over-year to $5.5 billion, beating the consensus estimates by 11.1%. Further, its adjusted EPS soared 111.1% year-over-year to $1.71, surpassing the Street’s expectations by 32.6%. Moreover, Newmont generated $1.6 billion in free cash flows, marking Q3 as the fourth consecutive quarter of over $1 billion in free cash flows.
These results were supported by 1.4 million gold ounces production during the quarter, coupled with sky-high gold prices. However, the recent cold down in gold prices since Oct. 21 has raised concerns among investors regarding the sustainability of these financials. Moreover, a further drop in gold prices can significantly hamper Newmont’s Q4 results.
For the full fiscal 2025, ending in December, analysts expect NEM to deliver an adjusted EPS of $5.75, up 65.2% year-over-year. The company has a robust earnings surprise history. It has surpassed the Street’s bottom-line estimates in each of the past four quarters.
Among the 21 analysts covering the stock, the consensus rating is a “Strong Buy.” That’s based on 15 “Strong Buys,” two “Moderate Buys,” and four “Holds.”
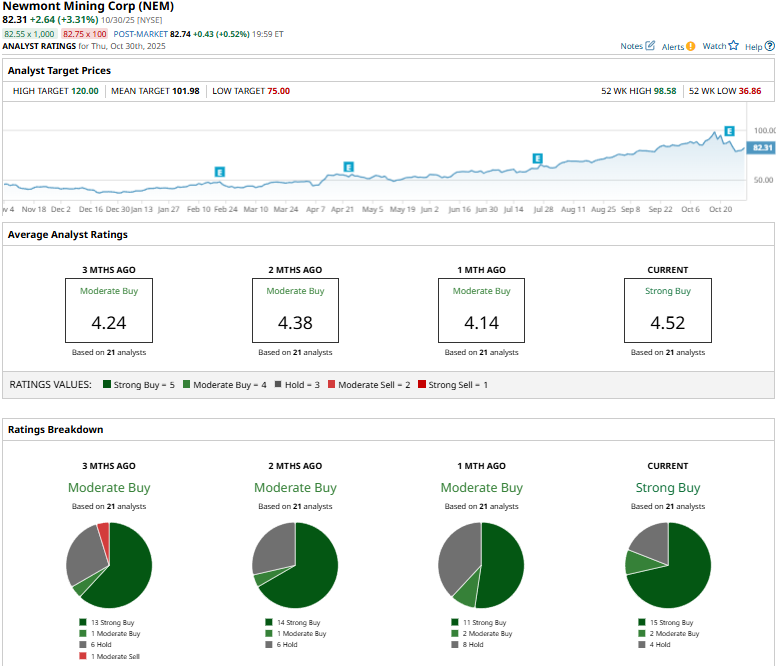
This configuration is notably more optimistic than a month ago, when only 11 analysts gave “Strong Buy” recommendations.
On Oct. 16, UBS (UBS) analyst Daniel Major maintained a “Buy” rating on Newmont and raised the price target from $92 to $105.50.
Newmont’s mean price target of $101.98 suggests a 23.9% upside potential. Meanwhile, the street-high target of $120 represents a 45.8% premium to current price levels.
On the date of publication, Aditya Sarawgi did not have (either directly or indirectly) positions in any of the securities mentioned in this article. All information and data in this article is solely for informational purposes. For more information please view the Barchart Disclosure Policy here.
More news from Barchart
- PayPal Is Paying Its First-Ever Dividend. Should You Snap Up PYPL Stock Now?
- Use This Treasury Strategy to Invest in US Bonds for Steady Income
- Fiserv Stock’s 44% Single-Day Plunge Proves That Stop Orders Don’t Work, But This Option Strategy Could Have Prevented the Carnage
- 1 Fintech Stock Under $400 to Buy and Hold Forever