Woking, UK-based Linde plc (LIN) operates as a specialty chemical company. It offers various atmospheric gases and is involved in the processing of oxygen, nitrogen, argon, carbon dioxide, acetylene, and more. With a market cap of $196.4 billion, Linde’s operations span the Americas, Europe, the Indo-Pacific, and Africa.
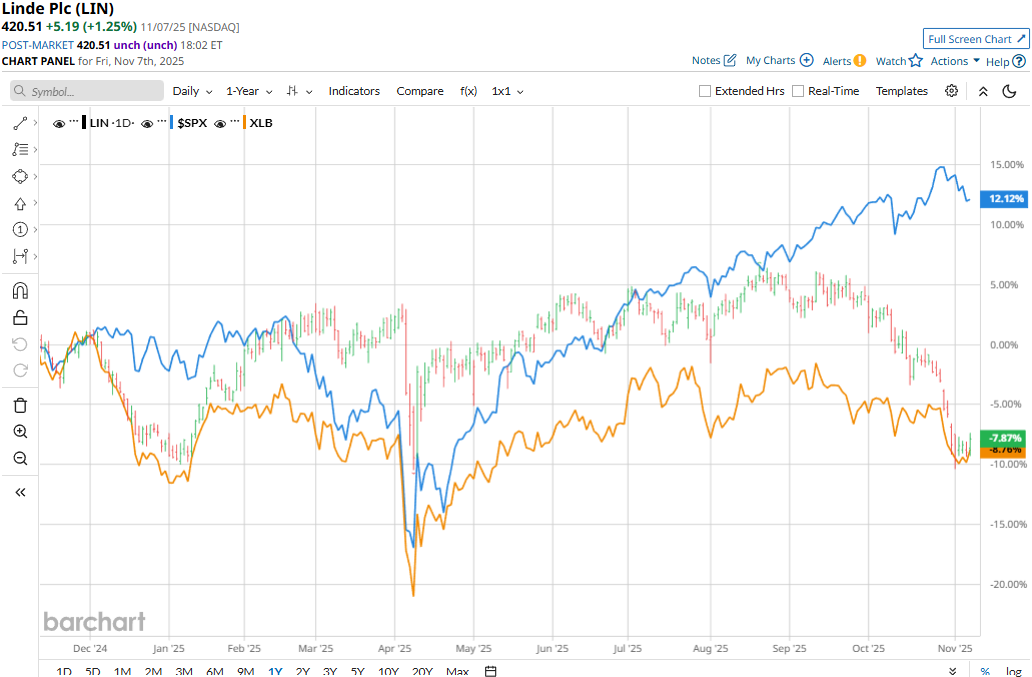
Specialty chemical giant Linde has notably underperformed the broader market over the past year. LIN stock prices have observed a marginal 44 bps uptick on a YTD basis and declined 9.7% over the past 52 weeks, compared to the S&P 500 Index’s ($SPX) 14.4% gains in 2025 and 12.7% returns over the past year.
Narrowing the focus, LIN has also underperformed the Materials Select Sector SPDR Fund’s (XLB) 2% uptick in 2025, but marginally outperformed XLB’s 10% plunge over the past 52 weeks.
Linde’s stock prices dropped 2.7% in the trading session following the release of its Q3 results on Oct. 31. While the company’s Indo-Pacific sales remained under pressure, its Americas sales grew by 6% and EMEA sales observed a 3% growth. Overall, the company’s topline increased 3.1% year-over-year to $8.6 billion, surpassing the Street’s expectations by 17 bps. Meanwhile, its adjusted EPS increased 6.9% year-over-year to $4.21, exceeding the consensus estimates by 72 bps.
Despite the better-than-expected earnings, Linde reduced the high-end of its full-year earnings guidance, which wasn’t received well by the investors.
For the full fiscal 2025, ending in December, analysts expect LIN to deliver an adjusted EPS of $16.43, up 5.9% year-over-year. The company has a solid earnings surprise history. It has surpassed the Street’s bottom-line estimates in each of the past four quarters.
Among the 27 analysts covering the stock, the consensus rating is a “Strong Buy.” That’s based on 19 “Strong Buys,” two “Moderate Buys,” and six “Holds.”
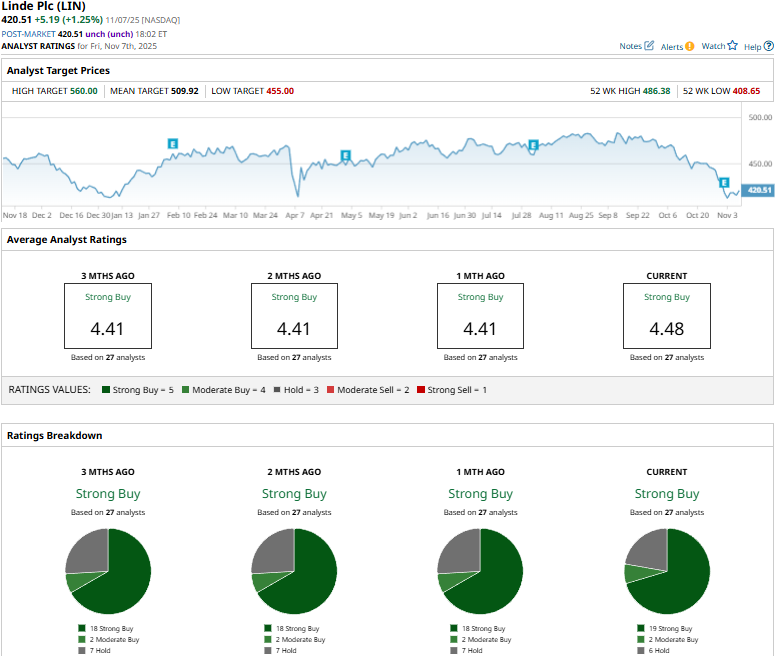
This configuration is slightly more optimistic than a month ago, when only 18 analysts gave “Strong Buy” recommendations.
On Nov. 6, RBC Capital analyst Arun Viswanathan reiterated an “Outperform” rating on LIN, but lowered the price target from $576 to $540.
Linde’s mean price target of $509.92 represents a 21.3% premium to current price levels. Meanwhile, the street-high target of $560 suggests a 33.2% upside potential.
On the date of publication, Aditya Sarawgi did not have (either directly or indirectly) positions in any of the securities mentioned in this article. All information and data in this article is solely for informational purposes. For more information please view the Barchart Disclosure Policy here.
More news from Barchart
- Missed The AI Trade? The Next Wave Of Alpha Is Hidden In Structure
- Technical Support Levels, CPI and Other Key Things to Watch this Week
- Nvidia Looks 22% Undervalued Here Based on Projected FCF Margins - $230 Price Target
- Michael Burry Is Betting Against Palantir Stock. At Least 1 Analyst Thinks It Can Gain 50% from Here.