Valued at a market cap of $34.3 billion, Fiserv, Inc. (FI) is a financial-technology company based in Milwaukee, Wisconsin. It provides a wide range of payments and fintech solutions, including transaction processing, digital banking, merchant acquiring, billing and payments, and point-of-sale systems to financial institutions, businesses and merchants.
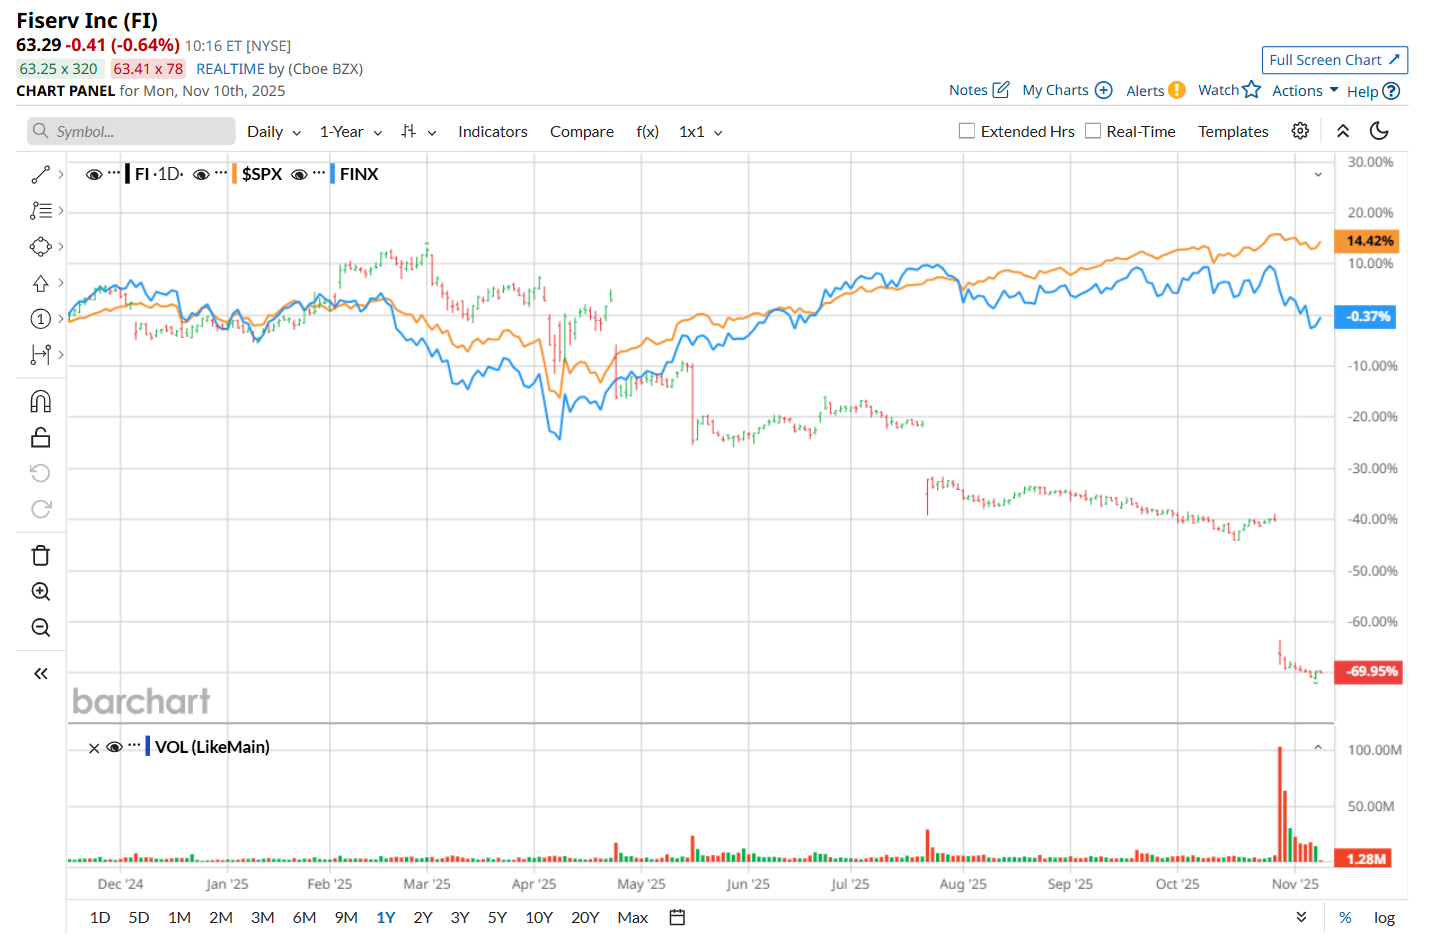
Shares of this fintech company have significantly underperformed the broader market over the past 52 weeks. FI has declined 70% over this time frame, while the broader S&P 500 Index ($SPX) has gained 13.5%. Moreover, on a YTD basis, the stock is down 69.2%, compared to SPX’s 15.7% return.
Narrowing the focus, FI has also notably lagged behind the Global X FinTech ETF’s (FINX) 1.8% rise over the past 52 weeks and 3.4% uptick on a YTD basis.
On Oct. 29, shares of FI plunged by a stagering 44% after its underwhelming Q3 earnings release. The company’s total revenue increased marginally year-over-year to $5.3 billion, while its adjusted revenue came in at $4.9 billion, missing consensus estimates. Moreover, its adjusted EPS of $2.04 declined 11.3% from the same period last year, falling 22.7% short of analyst expectations. Its performance was pressured by a notable 320 basis-point drop in adjusted operating margin and a decline in organic revenue within the financial solutions segment.
For the current fiscal year, ending in December, analysts expect FI’s EPS to decline 1.6% year over year to $8.66. The company’s earnings surprise history is mixed. It topped the consensus estimates in three of the last four quarters, while missing on another occasion.
Among the 36 analysts covering the stock, the consensus rating is a "Hold,” which is based on six “Strong Buy,” four “Moderate Buy,” 23 "Hold,” and three “Strong Sell” ratings.
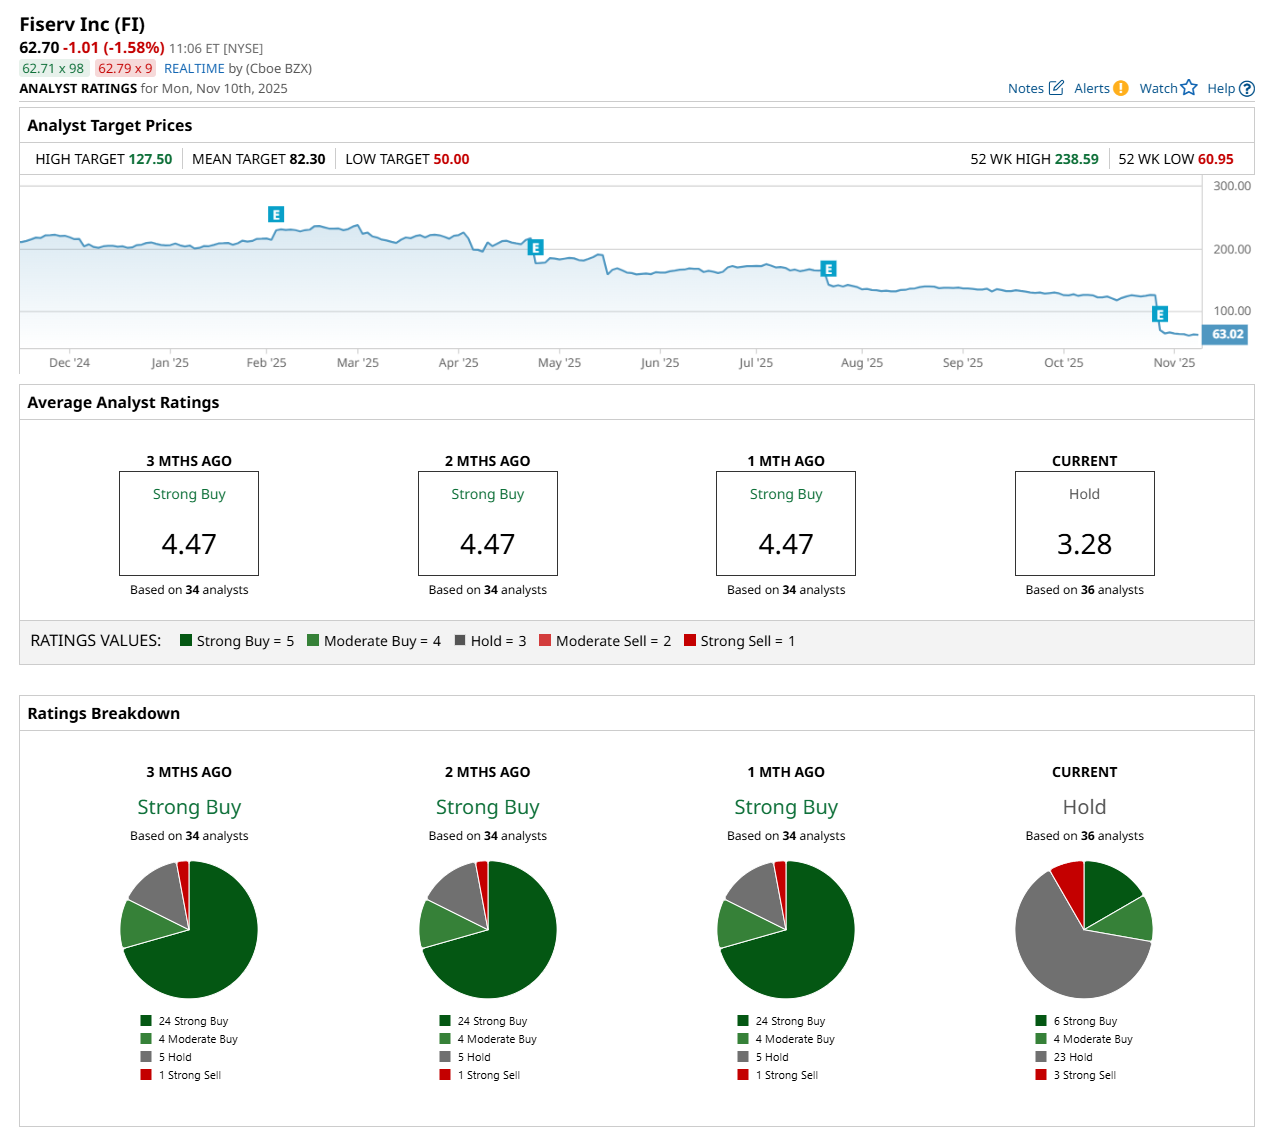
This configuration is significantly less bullish than a month ago, with an overall “Strong Buy” rating, consisting of 24 analysts suggesting a “Strong Buy,” and one recommending a “Strong Sell” rating.
On Nov. 5, BNP Paribas Exane downgraded Fiserv to “Neutral” with a $62 price target.
The mean price target of $82.30 represents a 31.3% premium from FI’s current price levels, while the Street-high price target of $127.50 suggests an ambitious upside potential of 103.3%.
On the date of publication, Neharika Jain did not have (either directly or indirectly) positions in any of the securities mentioned in this article. All information and data in this article is solely for informational purposes. For more information please view the Barchart Disclosure Policy here.
More news from Barchart
- As Trump Doubles Down on Nuclear Energy, Here Is the Top-Rated Stock to Buy
- Does the Upcoming SoFi USD Crypto Launch Make SOFI Stock a Buy, Sell, or Hold?
- This Canadian Dividend Stock Just Hit New All-Time Highs
- These 2 Stocks Are Flashing Bright Red Warning Signs on the Charts… Plus 1 Stock That Looks Primed to Keep Breaking Out


