Valued at a market cap of $17.3 billion, Alliant Energy Corporation (LNT) is a regulated utility company that provides electricity and natural gas services in the U.S. The Madison, Wisconsin-based company focuses on delivering reliable, affordable, and sustainable energy through a balanced mix of wind, solar, natural gas, hydropower, and coal generation, supported by investments in clean energy and grid modernization.
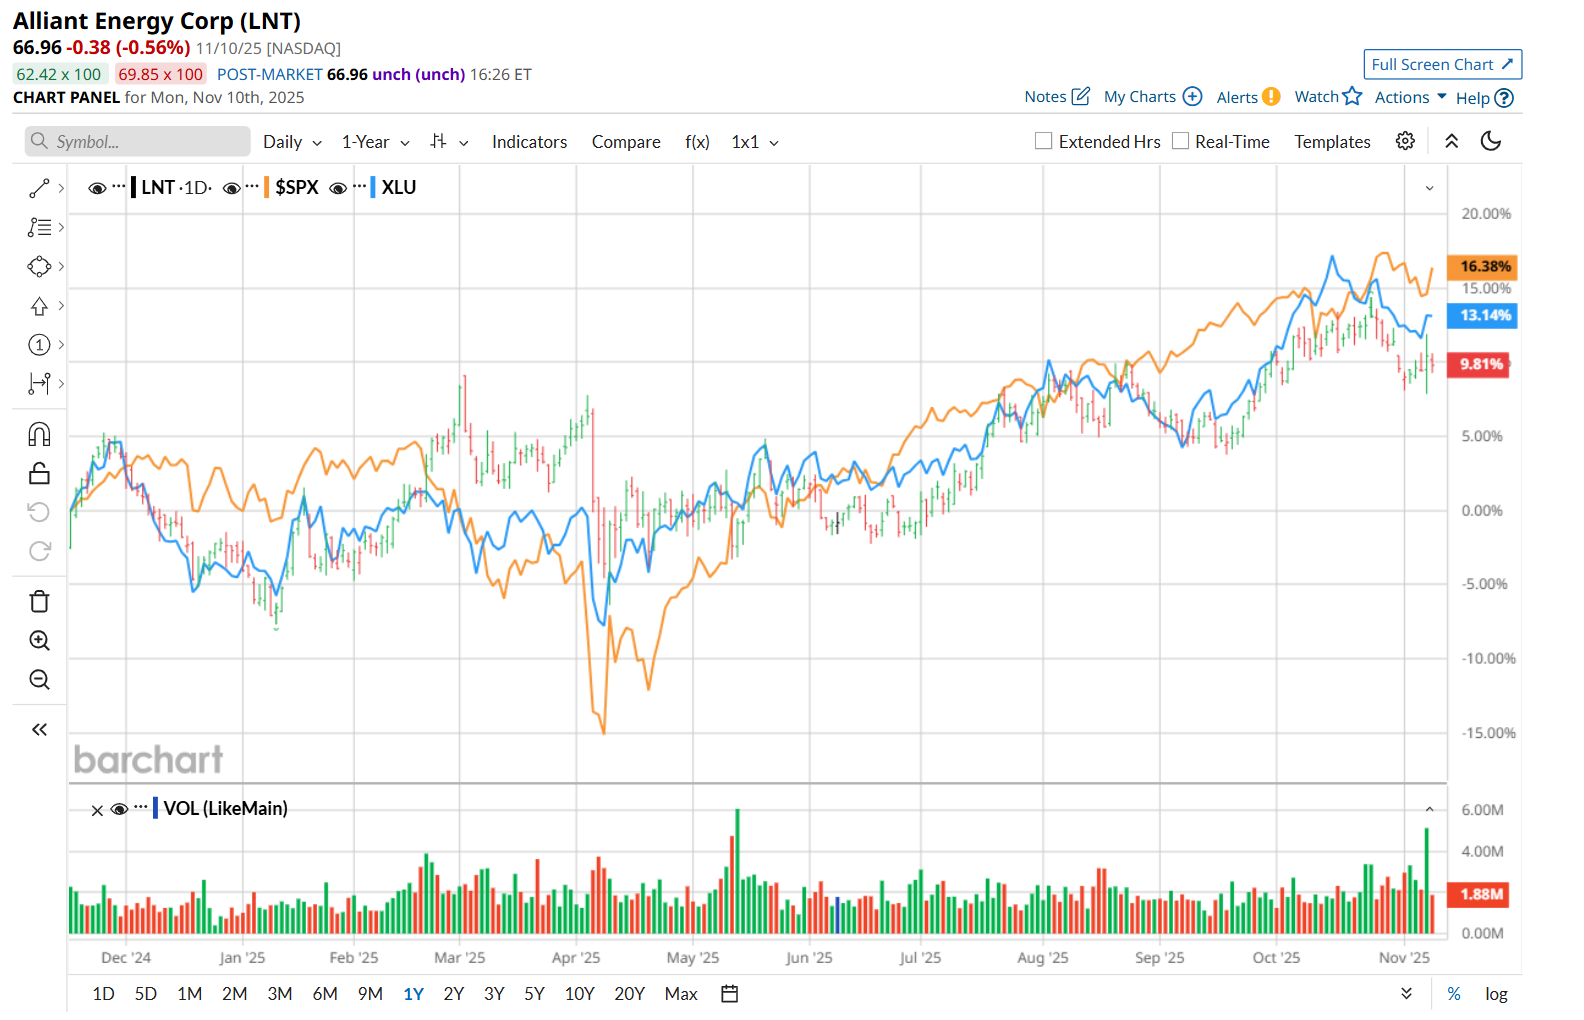
Shares of this utility company have outpaced the broader market over the past 52 weeks. LNT has surged 16% over this time frame, while the broader S&P 500 Index ($SPX) has gained 14%. However, on a YTD basis, the stock is up 13.2%, lagging behind SPX’s 16.2% return.
Zooming in further, LNT has also outperformed the Utilities Select Sector SPDR Fund’s (XLU) 13.2% rise over the past 52 weeks. Meanwhile, it has trailed behind XLU’s 18.5% uptick on a YTD basis.
On Nov. 6, LNT released its Q3 results, and its shares surged marginally in the following trading session. The company’s total revenue improved 11.9% year-over-year to $1.2 billion, driven by a 12.5% increase in electric utility revenue. On the other hand, its ongoing EPS declined 2.6% from the prior-year quarter to $1.12, missing analyst estimates by 4.3%. The earnings decline can be primarily attributed to higher other operation and maintenance expenses, depreciation, and financing costs. However, despite the bottom-line miss, LNT announced fiscal 2026 earnings guidance of $3.36 to $3.46 per share, continuing its strong 10-year track record of compound annual earnings growth of 6%, bolstering investor confidence.
For the current fiscal year, ending in December, analysts expect LNT’s EPS to grow 5.6% year over year to $3.21. The company’s earnings surprise history is mixed. It topped the consensus estimates in three of the last four quarters, while missing on another occasion.
Among the 11 analysts covering the stock, the consensus rating is a "Moderate Buy,” which is based on six “Strong Buy,” four “Hold,” and one “Strong Sell” rating.
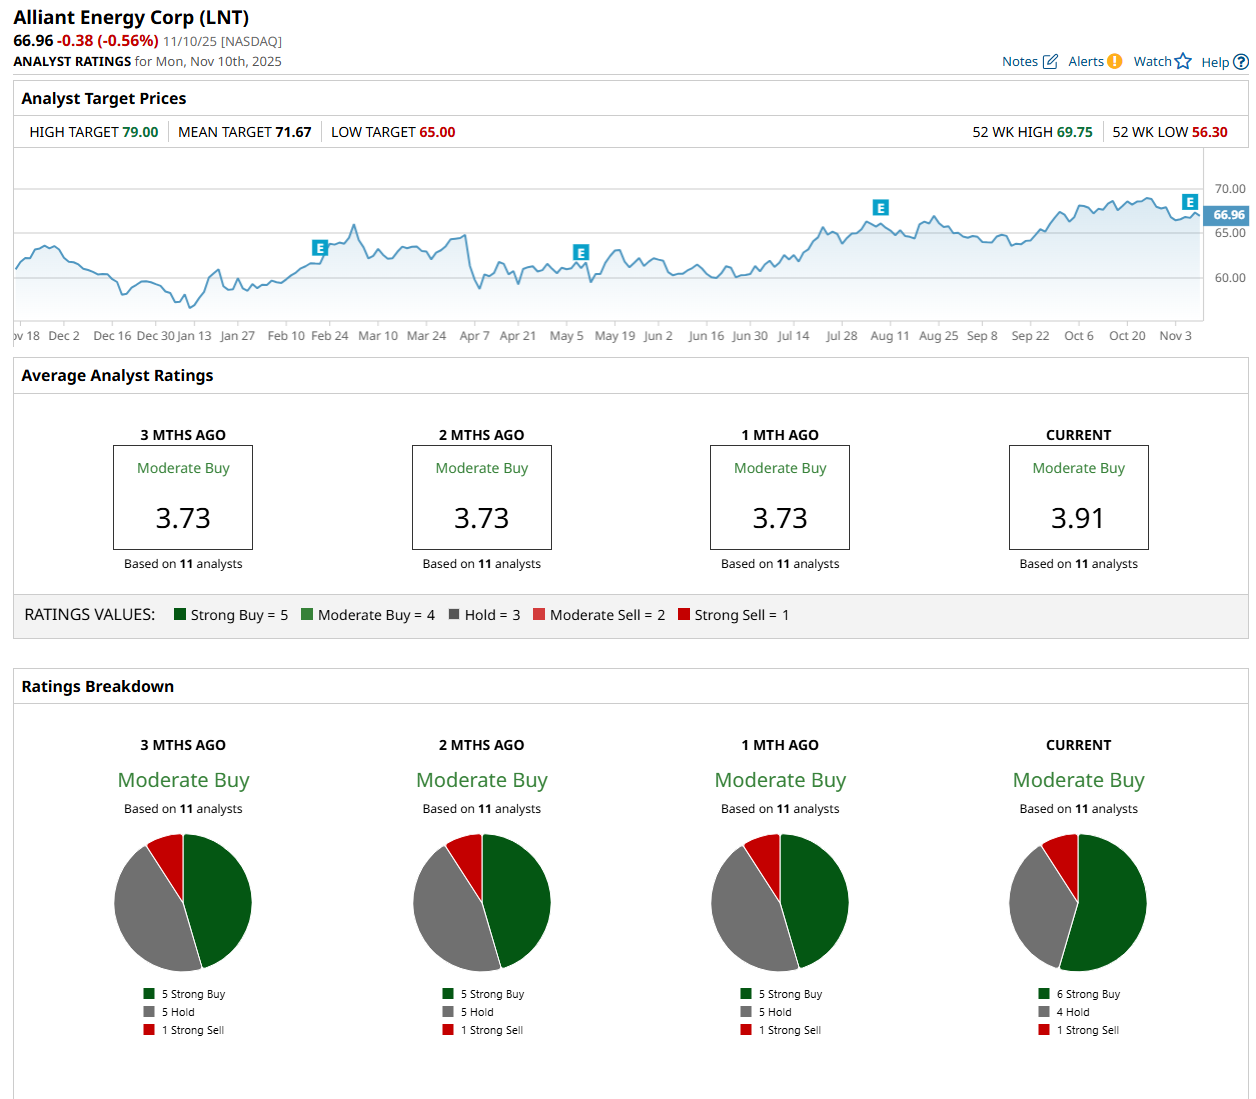
This configuration is slightly more bullish than a month ago, with five analysts suggesting a “Strong Buy” rating.
On Nov. 10, The Bank of Nova Scotia (BNS) analyst Andrew Weisel maintained a "Hold" rating on LNT and set a price target of $67, indicating a marginal potential upside from the current levels.
The mean price target of $71.67 represents a 7% premium from LNT’s current price levels, while the Street-high price target of $79 suggests an upside potential of 18%.
On the date of publication, Neharika Jain did not have (either directly or indirectly) positions in any of the securities mentioned in this article. All information and data in this article is solely for informational purposes. For more information please view the Barchart Disclosure Policy here.
More news from Barchart


