Alphabet, Inc. (GOOG, GOOGL) produced strong free cash flow and FCF margins, which hit 23.9% of revenue in Q3. This was after an unexpected dip in Q2 to just 5.50%, as I discussed in a Sept. 26 Barchart article. If it keeps generating FCF margins between 20% and 22%, GOOGL stock could be worth over 40% more over the next year. This article will show why.
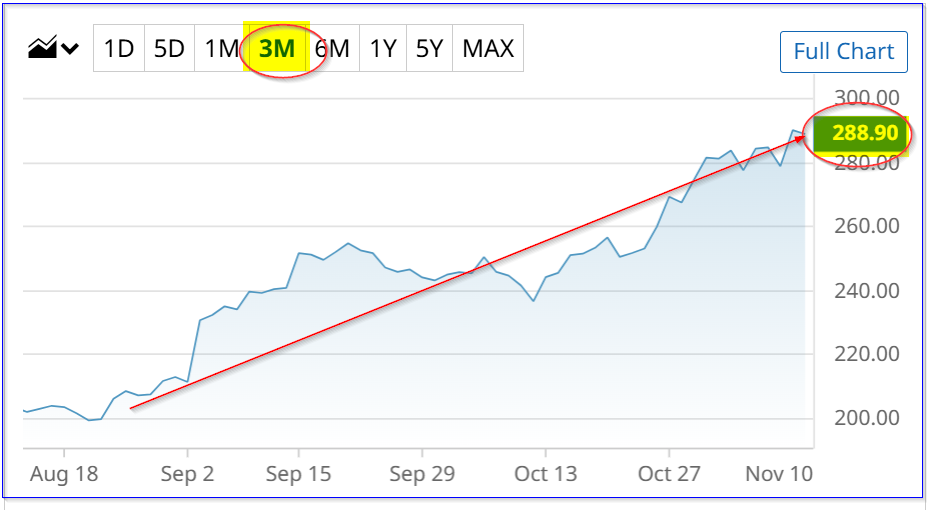
GOOGL is at $289.55, up after its earnings release on Oct. 29.

This would make its price target worth $408 over the next year, based on analysts' revenue projections. This article will show how it works out and several ways to play the stock.
Strong FCF Margins Despite Higher Capex Spending
Alphabet's revenue rose 15.95% to over $100 billion in a quarter for the first time ($1032.346 billion vs. $88.268 billion a year ago).
This was driven by strong Services revenue, up +14% to $87.1 billion, including Search, YouTube, subscriptions, etc. However, its Cloud division sales were up 34%. Alphabet implied that AI-related initiatives are driving its growth. After all, it is spending a good deal more on AI.
For example, its capex spending rose from $13 billion a year ago to $23.95 billion in Q3, as seen on page 8 of its earnings release. That is a +84% increase in one year.
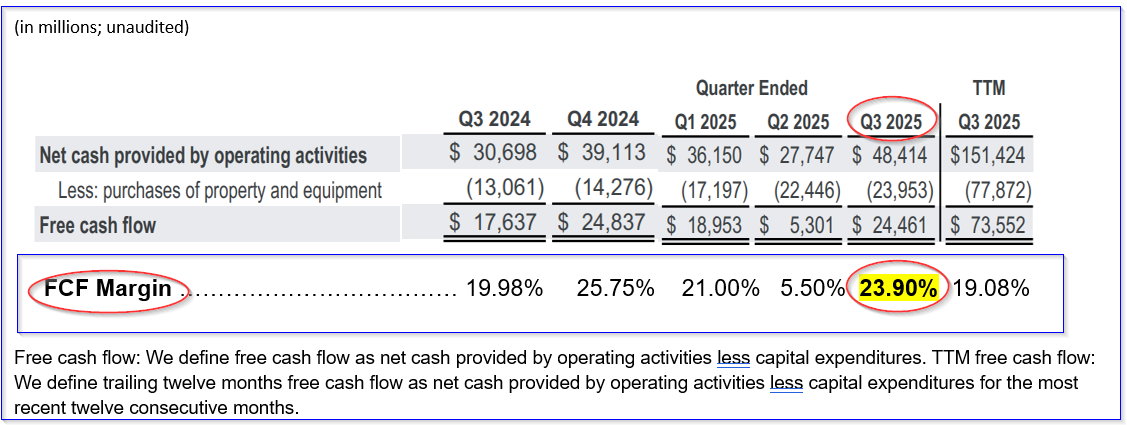
Nevertheless, despite this, its free cash flow (FCF) margin (i.e., after capex spending) stayed strong. This can be seen in the table below, taken from page 8 of Alphabet's Q3 earnings release and from page 8 of its Q2 release; the FCF margin data is from Stock Analysis:

It shows that capex spending has been increasing each quarter, yet, other than Q2, its FCF margins have stayed strong. They have ranged from 20% to 25.75%, not including Q2.
In fact, the TTM average was 19%, but the last four quarters, not including Q2, show an average of 22.66%.
We can use this to forecast FCF going forward.
Projecting FCF and a Price Target
For example, analysts now project that revenue next year will rise 13.3% from about $400 billion this year to almost $453 billion in 2026.
So, if we assume that FCF margins will stay at 22.0% next year, its FCF could rise to about $100 billion:
0.22 x $453 billion 2026 revenue est. = $99.7 billion FCF in 2026
That would be a huge increase over its $73.552 billion generated in the trailing 12 months (TTM), almost +36% more:
$99.7 b /$73.552 b = 1.3956 -1 = +35.55% gain in FCF
So, just to be conservative, let's assume its FCF margin will be just 20%:
0.20 x $453b revenue 2026 = $90.6 billion FCF 2026
That means its gain would still be +23% more over the last year.
How will the market value this? Let's assume it values the stock with a 1.93% FCF yield. For example, Yahoo! Finance says the Alphabet market cap is $3.489 trillion today.
That implies that the TTM FCF yield is 1.675% (i.e., $73.552b / $4,389b = 0.01675. So, just to be conservative, let's use a 15% higher FCF yield metric, or 1.93%:
$99.7b FCF (using a 22.66% FCF margin) / 0.0193 = $5,165.8 billion market cap
$90.6 b FCF (using a 20% FCF margin) / 0.0193= $4,694.3 billion mkt cap
These two market values are +48.0% and +34.5% higher than today's market value, respectively. That works out to an average price gain of 41.25% from today's price.
In other words, GOOGL stock is worth about 41% more or $408 per share:
1.41 x $289.55 = $408.27 price target
One way to play this is to sell short out-of-the-money puts, as I discussed in my last article. That worked out well.
Shorting OTM GOOGL Puts
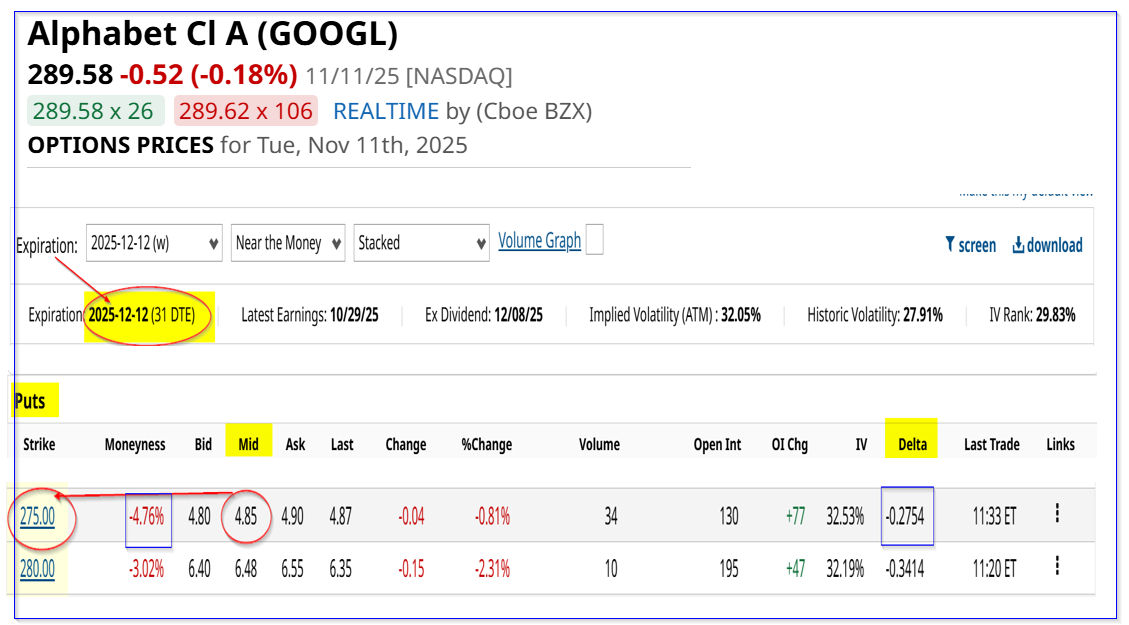
For example, the $275.00 put option expiring Dec. 12, one month away, has a midpoint premium of $4.85 per put contract.
That provides an investor who enters an order to “Sell to Open” this contract, after securing $27,500 in cash or buying power, will earn $485.00.
This is an immediate yield of 1.764% over the next month (i.e., $485/$27,500).

It also allows the investor to set a potentially lower buy-in point:
$275.00 - $4.85 = $270.15 breakeven
That is -6.7% below today's price of $278.57 per share. So, it has a good downside protection element. Moreover, if an investor can repeat this each month for 6 months, the expected return (ER) is over +10.5%:
1.764% x 6 = 10.584% ER
Obviously, there is no guarantee that an investor can achieve these yields each month. Nevertheless, it shows that a good return can potentially be made by selling short out-of-the-money (OTM) puts in GOOGL stock.
The bottom line is the Alphabet looks deeply undervalued, especially if it continues to make strong FCF margins.
On the date of publication, Mark R. Hake, CFA did not have (either directly or indirectly) positions in any of the securities mentioned in this article. All information and data in this article is solely for informational purposes. For more information please view the Barchart Disclosure Policy here.
More news from Barchart
- Enovix (ENVX) Offers the Most Daring Contrarians a Quant-Driven Upside Opportunity
- Alphabet Generates Strong FCF and If It Continues GOOGL Stock is 40% Undervalued
- AMD Short Strangle Could Net $1400 in a Few Weeks
- Options Traders Bet Beyond Meat Stock Could Move 30% When It Posts Delayed Q3 Earnings This Week


