Chicago, Illinois-based LKQ Corporation (LKQ) distributes replacement parts, components, and systems used in the repair and maintenance of vehicles and specialty vehicle aftermarket products and accessories. Valued at $7.8 billion by market cap, the company provides alternative collision replacement parts, recycled engines, transmissions, replacement systems, components, and parts for the repair of automobiles and light, medium, and heavy-duty trucks.
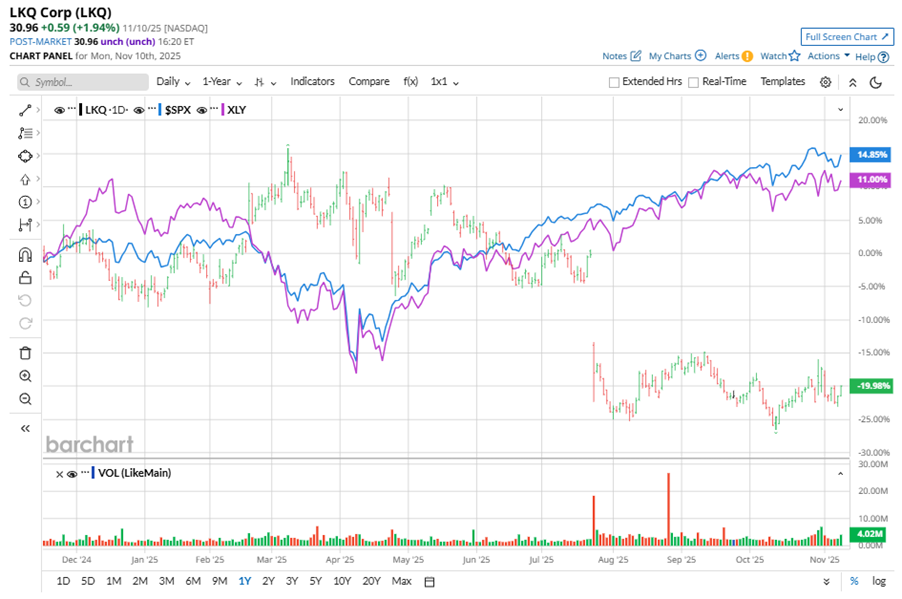
Shares of this leading distributor of automotive replacement parts have significantly underperformed the broader market over the past year. LKQ has declined 19.3% over this time frame, while the broader S&P 500 Index ($SPX) has rallied nearly 14%. In 2025, LKQ stock is down 15.8%, compared to the SPX’s 16.2% rise on a YTD basis.
Narrowing the focus, LKQ’s underperformance is also apparent compared to the Consumer Discretionary Select Sector SPDR Fund (XLY). The exchange-traded fund has gained about 11.1% over the past year. Moreover, the ETF’s 6.5% gains on a YTD basis outshine the stock’s double-digit losses over the same time frame.
LKQ's underperformance is attributed to delayed recovery of repairable claims in North America, tariff impacts, and soft market conditions in both North America and Europe.
On Oct. 30, LKQ shares closed up by 3.7% after reporting its Q3 results. Its adjusted EPS of $0.84 beat Wall Street expectations of $0.74. The company’s revenue was $3.50 billion, falling short of Wall Street forecasts of $3.53 billion. LKQ expects full-year adjusted EPS in the range of $3 to $3.15.
For the current fiscal year, ending in December, analysts expect LKQ’s EPS to decline 11.2% to $3.09 on a diluted basis. The company’s earnings surprise history is mixed. It beat or matched the consensus estimate in three of the last four quarters while missing the forecast on another occasion.
Among the eight analysts covering LKQ stock, the consensus is a “Moderate Buy.” That’s based on five “Strong Buy” ratings, one “Moderate Buy,” and two “Holds.”

This configuration is less bearish than a month ago, with one analyst suggesting a “Strong Sell.”
On Nov. 3, Gary Prestopino from Barrington reiterated a “Buy” rating on LKQ with a price target of $42.50, implying a potential upside of 37.3% from current levels.
The mean price target of $42.92 represents a 38.6% premium to LKQ’s current price levels. The Street-high price target of $50 suggests an ambitious upside potential of 61.5%.
On the date of publication, Neha Panjwani did not have (either directly or indirectly) positions in any of the securities mentioned in this article. All information and data in this article is solely for informational purposes. For more information please view the Barchart Disclosure Policy here.
More news from Barchart


