ETFOptimize | High-performance ETF-based Investment Strategies

Quantitative strategies, Wall Street-caliber research, and insightful market analysis since 1998.


ETFOptimize | HOME
Close Window

Are Wall Street Analysts Predicting DuPont de Nemours Stock Will Climb or Sink?

Wilmington, Delaware-based DuPont de Nemours, Inc. (DD) provides technology-based materials and solutions. With a market cap of $16.7 billion, the company offers a diverse range of products, such as construction materials, adhesives, electronics, fabrics, fibers, home garden, medical devices, resins, printing, and consumer products. 

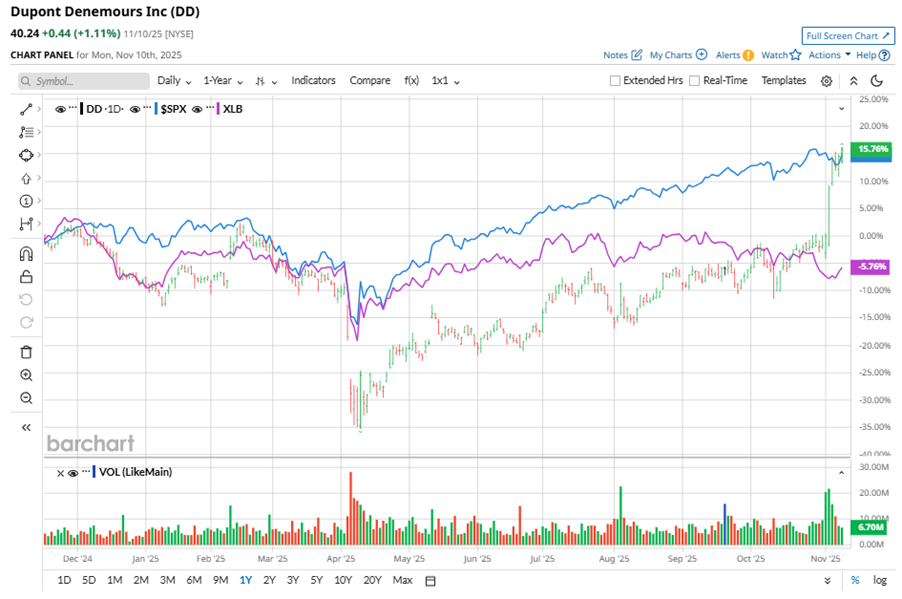
Shares of this chemical giant have outperformed the broader market over the past year. DD has gained 14.3% over this time frame, while the broader S&P 500 Index ($SPX) has rallied nearly 14%. In 2025, DD’s stock rose 26.1%, surpassing the SPX’s 16.2% rise on a YTD basis. 


Zooming in further, DD’s outperformance is also apparent compared to the Materials Select Sector SPDR Fund (XLB). The exchange-traded fund has declined about 8.3% on a YTD basis. Moreover, DD’s double-digit returns on a YTD basis outshine the ETF’s 3% gains over the same time frame.

www.barchart.com

On Nov. 6, DD shares closed down more than 1% after reporting its Q3 results. Its revenue stood at $3.1 billion, up 7.3% year-over-year. The company’s adjusted EPS came in flat year-over-year at $1.09. 

For the current fiscal year, ending in December, analysts expect DD’s EPS to decline 53.8% to $1.88 on a diluted basis. The company’s earnings surprise history is impressive. It beat the consensus estimate in each of the last four quarters.

Among the 17 analysts covering DD stock, the consensus is a “Moderate Buy.” That’s based on 12 “Strong Buy” ratings, one “Moderate Buy,” three “Holds,” and one “Strong Sell.”

www.barchart.com

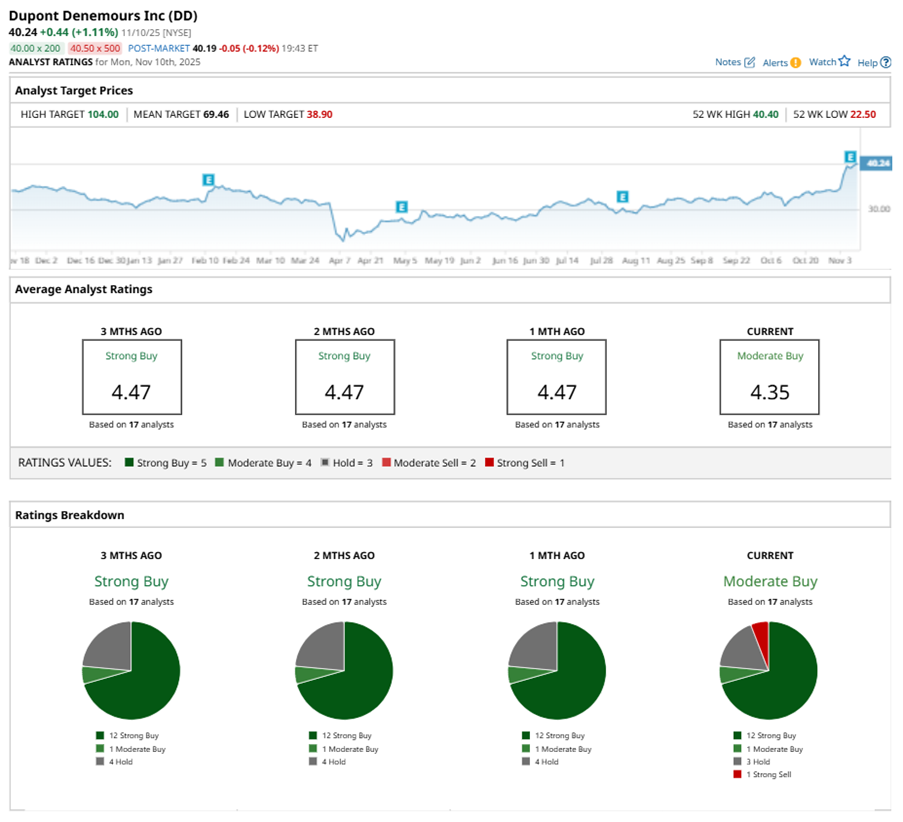
This configuration is less bullish than a month ago, with a “Strong Buy” rating overall. 

On Nov. 6, BMO Capital analyst John McNulty maintained a “Buy” rating on DD and set a price target of $50, implying a potential upside of 24.3% from current levels.

The mean price target of $69.46 represents a 72.6% premium to DD’s current price levels. The Street-high price target of $104 suggests an ambitious upside potential of 158.4%.


On the date of publication, Neha Panjwani did not have (either directly or indirectly) positions in any of the securities mentioned in this article. All information and data in this article is solely for informational purposes. For more information please view the Barchart Disclosure Policy here.


More news from Barchart

Recent Quotes

View More
Symbol Price Change (%)
AMZN  219.72
+2.58 (1.19%)
AAPL  272.84
+6.59 (2.48%)
AMD  205.41
-0.61 (-0.30%)
BAC  51.59
+0.59 (1.15%)
GOOG  300.75
+10.77 (3.71%)
META  595.25
+6.10 (1.04%)
MSFT  475.40
-3.03 (-0.63%)
NVDA  183.01
+2.38 (1.31%)
ORCL  198.90
-11.79 (-5.60%)
TSLA  400.22
+4.99 (1.26%)
Stock Quote API & Stock News API supplied by www.cloudquote.io
Quotes delayed at least 20 minutes.
By accessing this page, you agree to the Privacy Policy and Terms Of Service.


IntelligentValue Home
Close Window

DISCLAIMER

All content herein is issued solely for informational purposes and is not to be construed as an offer to sell or the solicitation of an offer to buy, nor should it be interpreted as a recommendation to buy, hold or sell (short or otherwise) any security.  All opinions, analyses, and information included herein are based on sources believed to be reliable, but no representation or warranty of any kind, expressed or implied, is made including but not limited to any representation or warranty concerning accuracy, completeness, correctness, timeliness or appropriateness. We undertake no obligation to update such opinions, analysis or information. You should independently verify all information contained on this website. Some information is based on analysis of past performance or hypothetical performance results, which have inherent limitations. We make no representation that any particular equity or strategy will or is likely to achieve profits or losses similar to those shown. Shareholders, employees, writers, contractors, and affiliates associated with ETFOptimize.com may have ownership positions in the securities that are mentioned. If you are not sure if ETFs, algorithmic investing, or a particular investment is right for you, you are urged to consult with a Registered Investment Advisor (RIA). Neither this website nor anyone associated with producing its content are Registered Investment Advisors, and no attempt is made herein to substitute for personalized, professional investment advice. Neither ETFOptimize.com, Global Alpha Investments, Inc., nor its employees, service providers, associates, or affiliates are responsible for any investment losses you may incur as a result of using the information provided herein. Remember that past investment returns may not be indicative of future returns.

Copyright © 1998-2017 ETFOptimize.com, a publication of Optimized Investments, Inc. All rights reserved.