Omaha, Nebraska-based Union Pacific Corporation (UNP) connects 23 states in the western two-thirds of the country by rail, providing a critical link in the global supply chain. With a market cap of $131.4 billion, Union Pacific ships just about anything: food, forest products, automobiles, agricultural products, coal, chemicals, and more.
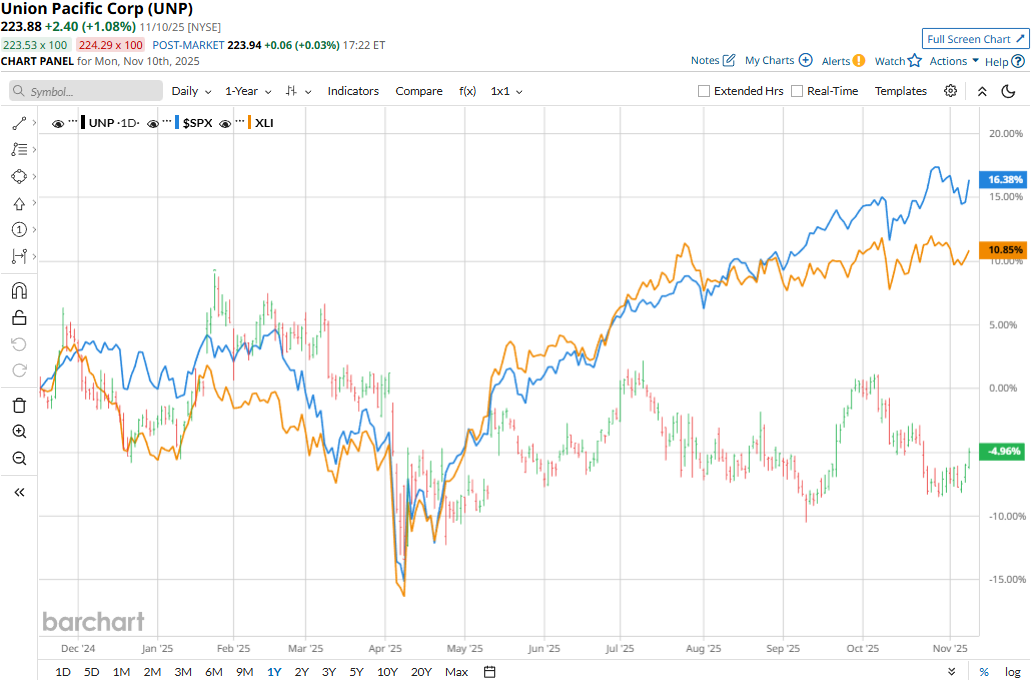
The railroad giant has notably underperformed the broader market over the past year. UNP stock prices have dipped 1.8% on a YTD basis and declined 7.3% over the past 52 weeks, compared to the S&P 500 Index’s ($SPX) 16.2% gains in 2025 and 14% returns over the past year.
Narrowing the focus, UNP has also underperformed the sector-focused Industrial Select Sector SPDR Fund’s (XLI) 17% returns in 2025 and 8.5% gains over the past 52 weeks.
Despite reporting better-than-expected results, Union Pacific’s stock prices dropped 2.3% in the trading session following the release of its Q3 results on Oct. 23. The company observed solid pricing gains, which mostly offset the decline in fuel surcharge. Its overall topline grew 2.8% year-over-year to $5.9 billion, beating the consensus estimates by 16 bps. Meanwhile, its adjusted EPS increased 12% year-over-year to $3.08, surpassing the Street’s expectations by 3%.
However, several key revenue sources, including Food & refrigerated, Energy & specialized markets, and Intermodal freight revenues, have observed notable declines during the quarter, which likely unsettled investor confidence.
For the full fiscal 2025, ending in December, analysts expect UNP to deliver an adjusted EPS of $11.76, up 6% year-over-year. The company has a mixed earnings surprise history. While it missed the Street’s bottom-line estimates once over the past four quarters, it surpassed the projections on three other occasions.
Among the 25 analysts covering the UNP stock, the consensus rating is a “Moderate Buy.” That’s based on 15 “Strong Buys,” one “Moderate Buy,” and nine “Holds.”
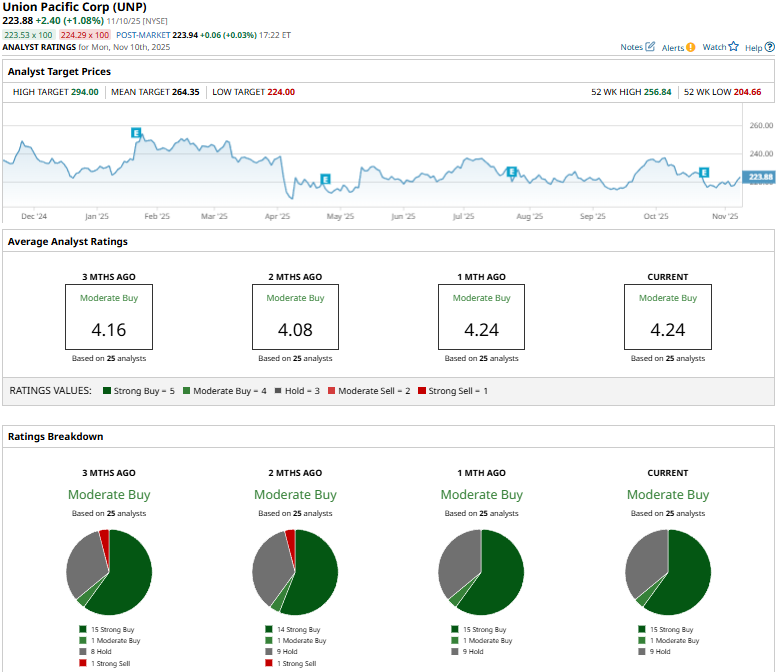
This configuration is notably more optimistic than three months ago, when one of the analysts gave a “Strong Sell” recommendation on UNP.
On Oct. 24, TD Cowen analyst Jason Seidl maintained a “Buy” rating on UNP, but notched down the price target from $258 to $257.
Union Pacific’s mean price target of $264.35 represents an 18.1% premium to current price levels. Meanwhile, the street-high target of $294 suggests a 31.3% upside potential.
On the date of publication, Aditya Sarawgi did not have (either directly or indirectly) positions in any of the securities mentioned in this article. All information and data in this article is solely for informational purposes. For more information please view the Barchart Disclosure Policy here.
More news from Barchart
- This Dividend Stock Yields More Than 8% and Analysts Say You Can ‘Count on It’ Here
- Google Has a ‘Secret Weapon’ That Could Make GOOGL Stock One of the Best AI Buys for 2026
- Plug Power Just Got a $275 Million Boost. Should You Buy PLUG Stock Here?
- Shareholders Just Approved a $1 Trillion Pay Package for Elon Musk. What Does That Mean for Tesla Stock in 2026?


