Even the strongest bull markets eventually show fatigue — and right now, quite a few technical traders are watching one key level to gauge whether momentum is shifting.
In the latest Market on Close, Senior Market Strategist John Rowland and co-host “Twitter Tom” discussed how the 50-day moving average acts as one of the most important gauges of market health, using the benchmark S&P 500 Index ($SPX) and its companion exchange-traded product, the SPDR S&P 500 ETF (SPY) as a case study.
The 50-Day: Why It Matters
The simple 50-day moving average (50-DMA) measures the average closing price of an index or stock over the last 50 trading days on a rolling basis.
When the price trades above it, the market is typically healthy and trending higher. When price falls below the moving average, it can signal weakness — or even the start of a larger correction.
“The 50-day moving average is a powerful indicator of a healthy market, or a fatigued one,” John said.
Internals Are Starting to Weaken
Market internals are metrics that look under the surface to compare the number of new highs and lows, advancing and declining stocks, and so on. The idea is to get a broader reading on how the stock market is performing across the board than a simple snapshot of index closing levels can provide. That’s why you’ll hear analysts refer to “market breadth” when discussing these internals.
Using his custom Dr. Alexander Elder chart template, John highlighted another important breadth metric — the New High–Low Accumulation Index — which tracks the net number of stocks hitting 52-week highs versus lows over a rolling five-day period.
“As long as that index stays above zero, the rally’s healthy,” he explained. “But once it drops below, that’s our first warning sign that market internals are deteriorating.”
That warning recently triggered when the index dipped below zero, aligning with weakening breadth across major sectors.
When John examined the 50-day moving average data under Market Performance, the results were clear. Some sectors now show fewer than 25% of their stocks trading above the 50-day moving average (DMA), meaning more than 75% are trading below it. Historically, such lopsided readings suggest growing downside risk.
“When we start seeing most sectors below the 50-day,” John said, “it’s a cautionary tale. It tells me the market might be at risk.”
SPY’s Historic Streak Above the 50-Day
Tom added another key data point to the conversation:
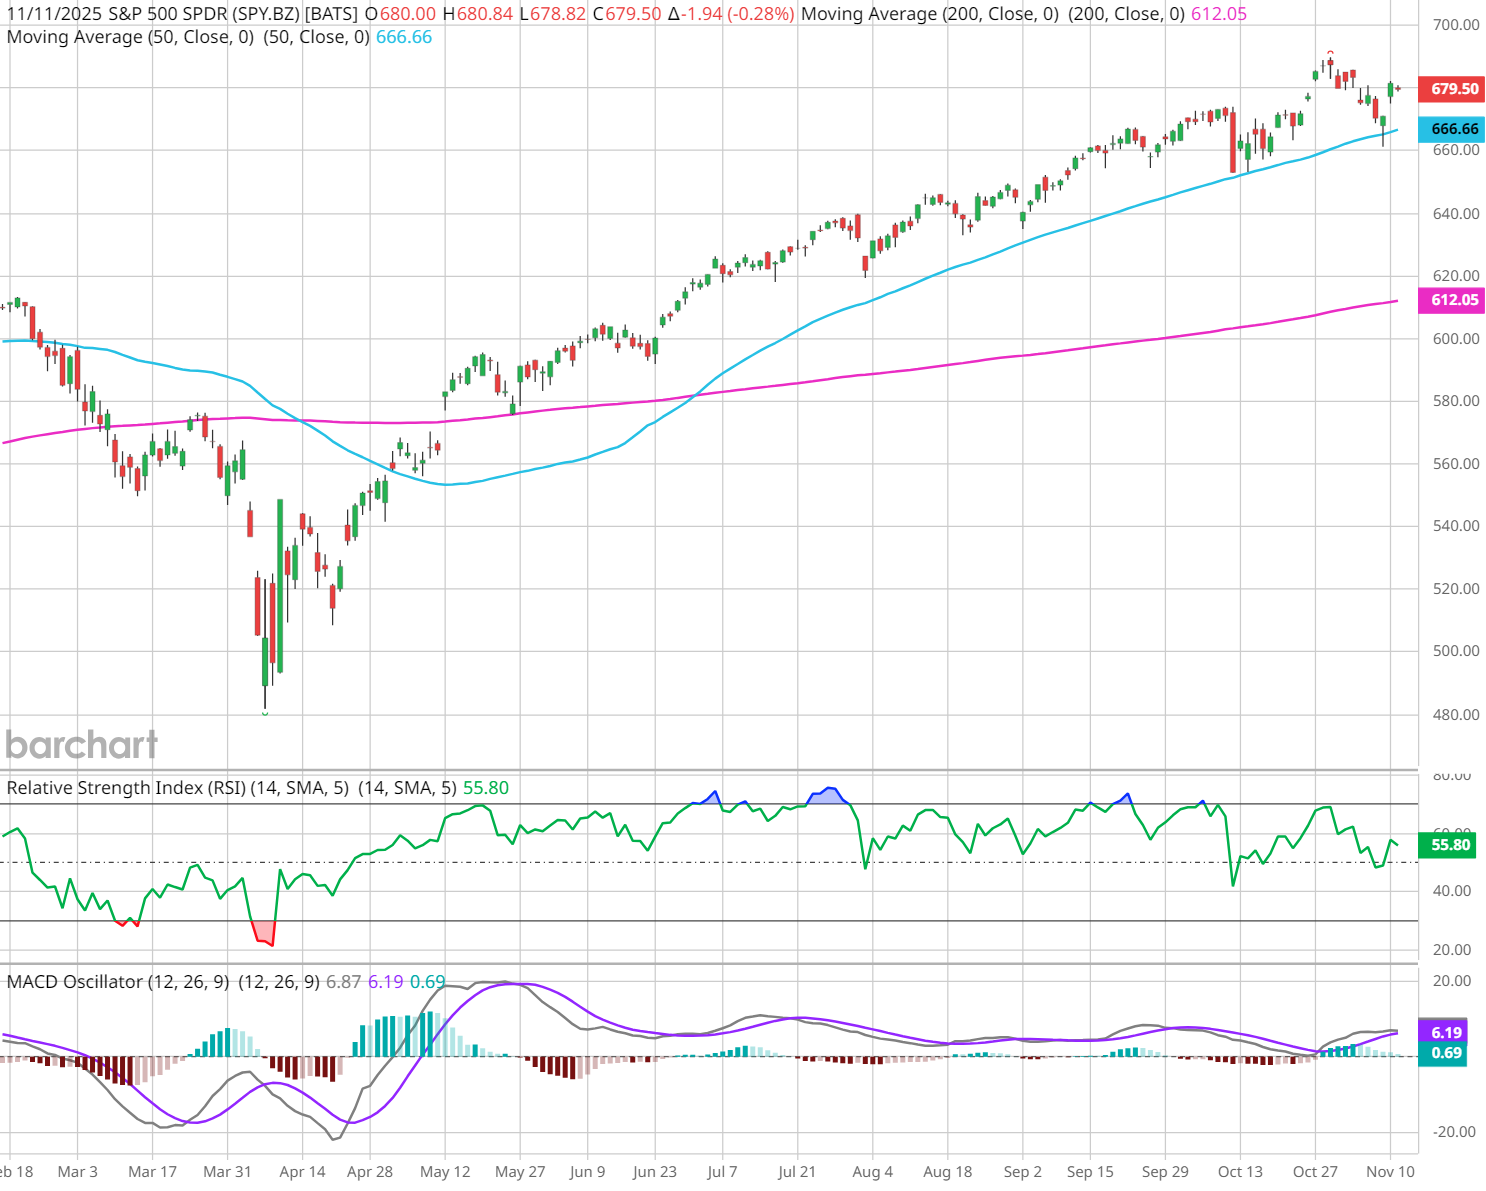
“The SPY has closed above its 50-day moving average for 131 consecutive days. Today would mark day 132 — but it actually dipped below the 50-day for the first time since April.”
That intraday break doesn’t guarantee a downturn, and SPY recovered to close last Friday above its 50-day moving average, which means the daily closing win streak above this key level has continued. However, additional tests and breaches of the SPY’s 50-day moving average could signal a change in character for the market.
Tools to Track Market Strength on Barchart
You can monitor these same market internals and trend signals directly on Barchart:
- New High–Low Accumulation Index ($MADX) – confirms bull markets and identifies bottoms by tracking the net new highs vs. lows.
- Market Cap High–Low Index ($FADX) – weights highs and lows by total capitalization for a broader view.
- Technical Analysis Page – view 50-day and 200-day moving average data for any stock or ETF.
- Market & Sector Performance – see what percentage of each sector’s stocks are above their 50-DMA in real time.
Why These Metrics Matter
The New High–Low Accumulation Index rises above +1,000 only during major bull markets and falls below –4,000 near major bottoms. When it rebounds from extreme lows, it often signals a powerful new uptrend.
Combined with the 50-day moving average, it gives traders a way to measure both momentum and breadth — the two cornerstones of market strength.
Final Takeaway
Markets don’t just turn overnight. The signs of a shift show up in the market's internal data first, before revealing itself in the broader market indices’ charts.
If the SPY can hold above its 50-day, the uptrend could continue. But if more sectors slide below their 50-DMA, traders should be prepared for the prospect of a deeper correction.
Watch the Clip: SPY’s 50-Day Streak vs. Sector Performance
- Study the SPY with New High–Low Accumulation Index
- Stream the Full Market on Close Episode
On the date of publication, Barchart Insights did not have (either directly or indirectly) positions in any of the securities mentioned in this article. All information and data in this article is solely for informational purposes. For more information please view the Barchart Disclosure Policy here.
More news from Barchart
- Enovix (ENVX) Offers the Most Daring Contrarians a Quant-Driven Upside Opportunity
- Alphabet Generates Strong FCF and If It Continues GOOGL Stock is 40% Undervalued
- Is Owens & Minor’s New Focus Enough to Lift Its Shares From the Bottom 100?
- SPY’s 50-Day Moving Average Streak is Going Strong. The Rest of the Market is Sending Up Flares.