The Sherwin-Williams Company (SHW), headquartered in Cleveland, Ohio, develops, manufactures, markets, and sells paints, coatings, and related products. Valued at $85.5 billion by market cap, the company’s Sherwin-Williams branded products are sold exclusively through a chain of more than 5,000 company-operated stores and facilities, while additional brands are sold through leading mass merchandisers, home centers, and more.
Shares of this coating giant have underperformed the broader market over the past year. SHW has declined 11.4% over this time frame, while the broader S&P 500 Index ($SPX) has rallied nearly 14.1%. In 2025, SHW stock is up 1.5%, compared to the SPX’s 16.2% rise on a YTD basis.
Narrowing the focus, SHW’s underperformance is also apparent compared to the Materials Select Sector SPDR Fund (XLB). The exchange-traded fund has declined about 6.9% on a YTD basis. Moreover, the ETF’s 4% gains on a YTD basis outshine the stock’s returns over the same time frame.
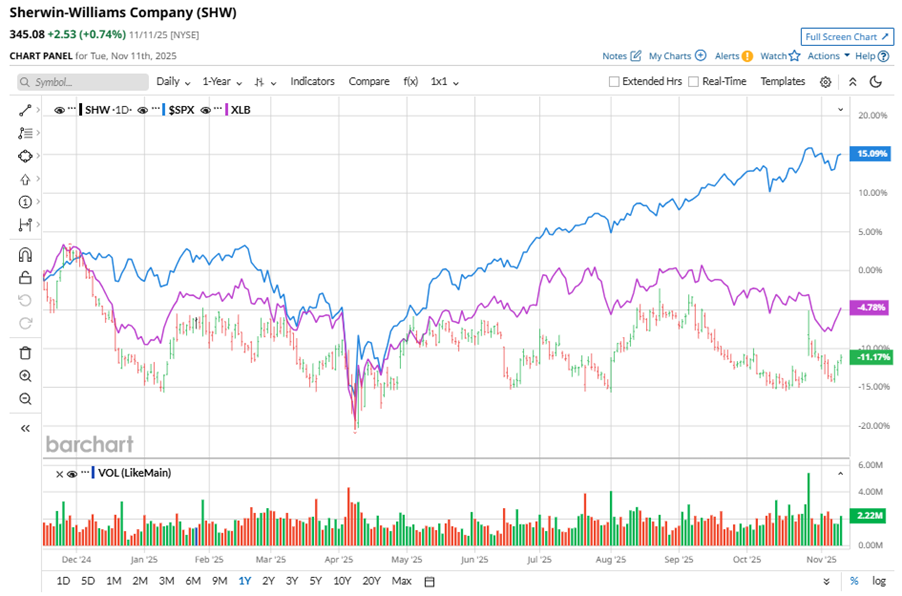
SHW's underperformance is attributed to the escalating Middle East conflict, a surge in crude oil prices, and investor anxiety over potential supply disruptions and broader regional conflict.
On Oct. 28, SHW shares closed up by 5.5% after reporting its Q3 results. Its adjusted EPS of $3.59 exceeded Wall Street expectations of $3.46. The company’s revenue was $6.4 billion, exceeding Wall Street forecasts of $6.2 billion. SHW expects full-year adjusted EPS in the range of $11.25 to $11.45.
For the current fiscal year, ending in December, analysts expect SHW’s EPS to grow marginally to $11.35 on a diluted basis. The company’s earnings surprise history is mixed. It beat the consensus estimate in three of the last four quarters while missing the forecast on another occasion.
Among the 27 analysts covering SHW stock, the consensus is a “Moderate Buy.” That’s based on 13 “Strong Buy” ratings, two “Moderate Buys,” and 12 “Holds.”
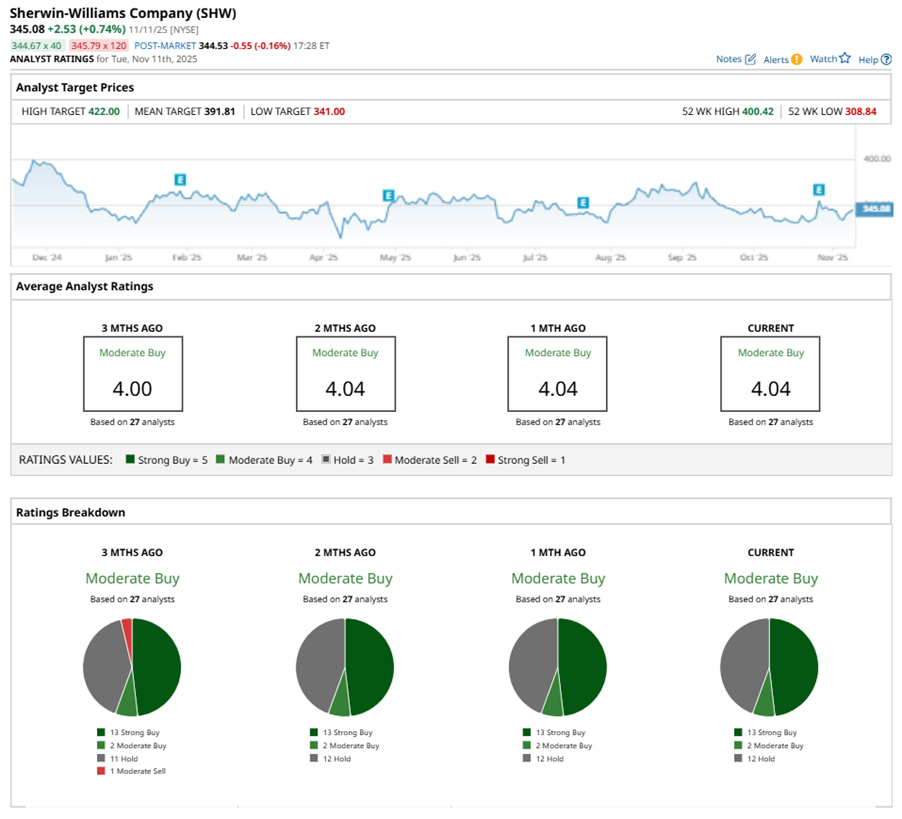
This configuration is less bearish than three months ago, with one analyst suggesting a “Moderate Sell.”
On Oct. 30, Citigroup Inc. (C) analyst Patrick Cunningham maintained a “Hold” rating on SHW and set a price target of $392, implying a potential upside of 13.6% from current levels.
The mean price target of $391.81 represents a 13.5% premium to SHW’s current price levels. The Street-high price target of $422 suggests an upside potential of 22.3%.
On the date of publication, Neha Panjwani did not have (either directly or indirectly) positions in any of the securities mentioned in this article. All information and data in this article is solely for informational purposes. For more information please view the Barchart Disclosure Policy here.
More news from Barchart
- I’m Preparing for a ‘Bang’ When the Nasdaq Crashes. Here’s How I’m Trading the QQQ ETF First.
- Bullish Tilt: Palantir Option Strategy Geared for Upside Gains
- S&P Futures Climb as U.S. Government Shutdown Nears End, Fed Speak on Tap
- This Buy-Rated Stock Just Raised Its Dividend 14%. Should You Buy Shares Here?