CME Group Inc. (CME), based in Chicago, Illinois, is one of the world’s foremost derivatives marketplaces. It operates several major exchanges, including the Chicago Mercantile Exchange, Chicago Board of Trade, New York Mercantile Exchange, and COMEX.
The company facilitates trading across diverse asset classes, including interest rates, equities, foreign exchange, energy, agriculture, and metals. Through its advanced electronic trading platform, CME Globex, it delivers efficient market access, price transparency, and robust risk management capabilities to participants worldwide. It has a market capitalization of $99.99 billion.
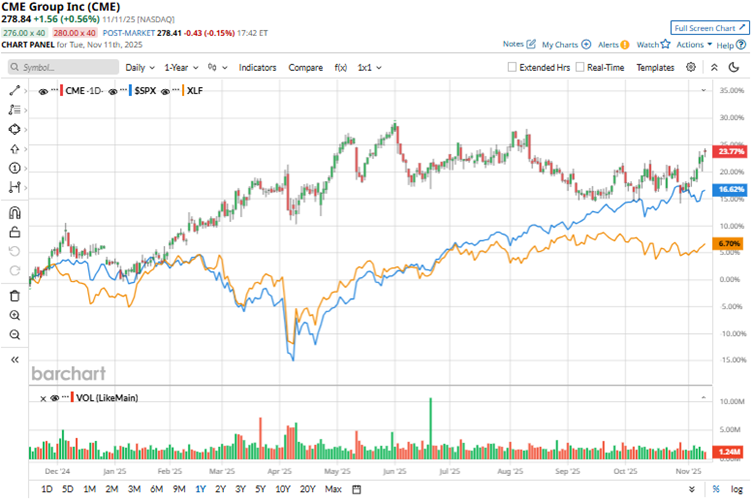
Stable fundamentals have led the stock to gain 23.4% over the past 52 weeks. However, short-term market volatility has likely resulted in a 2.4% decline in the stock’s value over the past three months. CME’s shares reached a 52-week high of $290.79 in June, but are now down 4.1% from that level.
On the other hand, the broader S&P 500 Index ($SPX) has gained 14.1% and 7.4% over the same periods, respectively, indicating that the stock has outperformed the broader market over the past year but underperformed it over the past three months.
Next, we compare the stock with its own sector. The Financial Select Sector SPDR Fund (XLF) gained 6.7% over the past 52 weeks and 2.7% over the past three months, exhibiting a similar trend to the broader market’s performance compared to CME’s stock.
On Oct. 22, CME reported its third-quarter results for fiscal 2025. The company’s revenue dropped by 3% year-over-year (YOY) to $1.54 billion, aligning with Wall Street analysts’ estimated figure. CME noted that its clients continue to trust its services amid market uncertainty, which led to the company recording its second-highest third-quarter average daily volume (ADV). Its adjusted EPS remained flat YOY at $2.68, surpassing analysts’ estimate of $2.63.
Recently, CME reported its highest October ADV on record at 26.3 million contracts. Notably, its cryptocurrency ADV grew 226% to 379,000 contracts, driven by Micro Ether Futures.
For the fiscal year 2025, which ends in December 2025, Wall Street analysts expect CME’s EPS to grow 8.5% YOY to $11.13 on a diluted basis. Moreover, EPS is expected to increase 3.9% annually to $11.56 in fiscal 2026. The company has a solid history of surpassing consensus estimates, topping them in all four trailing quarters.
Among the 19 Wall Street analysts covering CME’s stock, the consensus is a “Moderate Buy.” That’s based on six “Strong Buy” ratings, two “Moderate Buys,” eight “Holds,” one “Moderate Sell,” and two “Strong Sells.” The ratings configuration is more bullish than it was two months ago, with six “Strong Buy” ratings now, up from five previously.
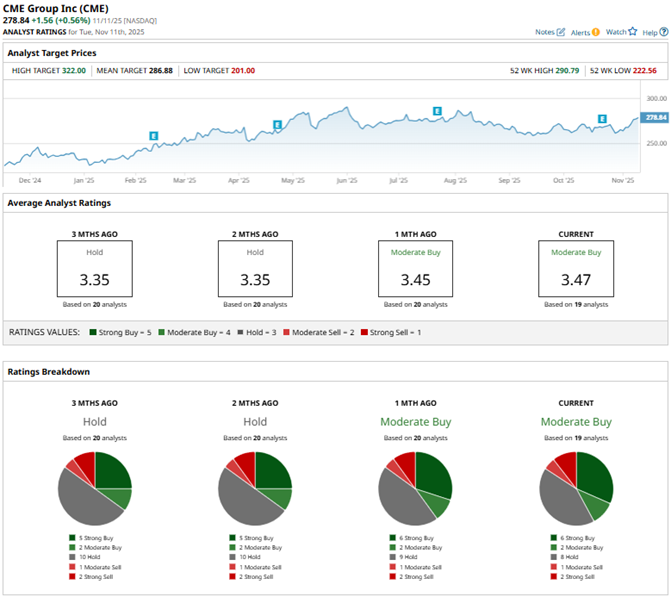
Last month, analysts at Deutsche Bank upgraded CME’s stock from a “Hold” to a “Buy,” while raising the price target from $266 to $300, based on the company’s strong Q3 results. This also reflects Deutsche Bank’s confidence in CME’s growth prospects, especially in the prediction markets.
CME’s mean price target of $286.88 indicates a 2.9% upside over current market prices. The Street-high price target of $322 implies a potential upside of 15.5%.
On the date of publication, Anushka Mukherjee did not have (either directly or indirectly) positions in any of the securities mentioned in this article. All information and data in this article is solely for informational purposes. For more information please view the Barchart Disclosure Policy here.
More news from Barchart
- As Palantir Gets 6M Shares of Surf Air Mobility Stock, Is PLTR or SRFM a Better Buy?
- I’m Preparing for a ‘Bang’ When the Nasdaq Crashes. Here’s How I’m Trading the QQQ ETF First.
- Bullish Tilt: Palantir Option Strategy Geared for Upside Gains
- S&P Futures Climb as U.S. Government Shutdown Nears End, Fed Speak on Tap


