With a market cap of $30.2 billion, Iron Mountain Incorporated (IRM) is a global leader in information management, specializing in the secure storage, protection, and management of physical and digital assets. Founded in 1951 and headquartered in New Hampshire, the company serves businesses worldwide across various industries, including healthcare, legal, financial, and government.
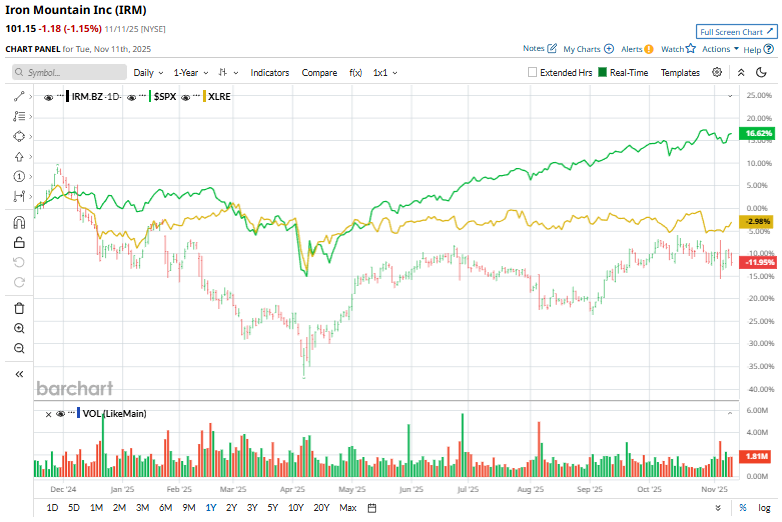
IRM shares have dropped 13.9% over the past year, trailing the broader S&P 500 Index ($SPX), which has gained 14.1%. Moreover, shares of IRM are down 3.8% on a YTD basis, compared to SPX’s 16.4% return.
Looking closer, the company has also struggled to keep up with the Real Estate Select Sector SPDR Fund’s (XLRE) 4.2% decline over the past 52 weeks and 2.5% rise in 2025.
On Nov. 5, Iron Mountain reported FY2025 Q3 results, and its shares slumped 2.8%. Its revenue rose 12.6% year over year to $1.75 billion, supported by solid demand across both its storage and services businesses. Storage rental revenue increased by 10% to $1.03 billion, while service revenue rose by 16% to $721 million.
Profitability also strengthened, with record adjusted EBITDA of $660 million, up 16%, and margin expansion of 110 basis points. Its AFFO rose 17% to $1.32 per share. Reflecting confidence in its performance and outlook, the company raised its dividend by 10% and reaffirmed guidance for double-digit revenue and EBITDA growth for the full year.
For the current fiscal year, ending in December 2025, analysts expect IRM’s AFFO to increase 154.8% year-over-year to $4.51 per share. The company's earnings surprise history is solid. It beat the consensus estimates in the last four quarters.
Among the 11 analysts covering the stock, the consensus rating is a “Moderate Buy.” That’s based on eight “Strong Buy” ratings, one “Moderate Buy,” one “Hold,” and one “Strong Sell.”
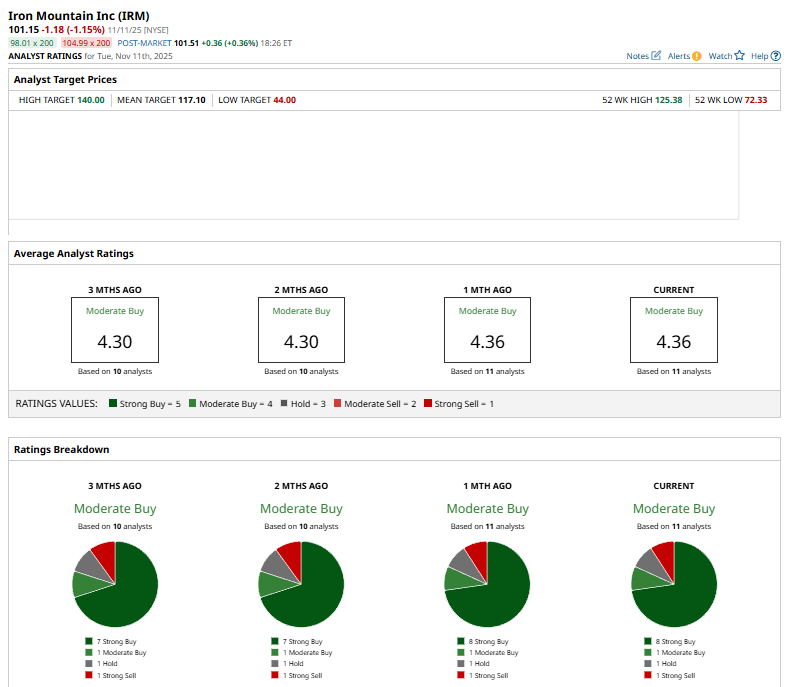
The current configuration is bullish than two months ago, when the stock had seven “Strong Buy” suggestions.
On Nov. 6, JPMorgan’s Andrew Steinerman lifted his price target on Iron Mountain to $111 from $100 and reiterated an “Overweight” rating, noting that the company’s Q3 results came in largely as expected with no major surprises.
Iron Mountain’s mean price target of $117.10 represents a 15.8% premium to the current market prices. The Street-high price target of $140 implies a potential upside of 38.4%.
On the date of publication, Kritika Sarmah did not have (either directly or indirectly) positions in any of the securities mentioned in this article. All information and data in this article is solely for informational purposes. For more information please view the Barchart Disclosure Policy here.
More news from Barchart
- S&P Futures Climb as U.S. Government Shutdown Nears End, Fed Speak on Tap
- This Buy-Rated Stock Just Raised Its Dividend 14%. Should You Buy Shares Here?
- Tesla Just Lost Its Cybertruck Leader. Should You Buy, Sell, or Hold TSLA Stock?
- Palantir Achieved ‘Eye-Popping Growth’ and Is a Buy Through Year-End, According to Wedbush


