Louisville, Kentucky-based Humana Inc. (HUM) is a health and well-being company that focuses on serving individuals, families, military service personnel, and communities through its insurance services and care delivery operations. Valued at a market cap of $29.3 billion, the company offers medical and specialty insurance products, including Medicare Advantage, stand-alone prescription-drug plans, and dental/vision benefits and operates clinical-care services through its division CenterWell.
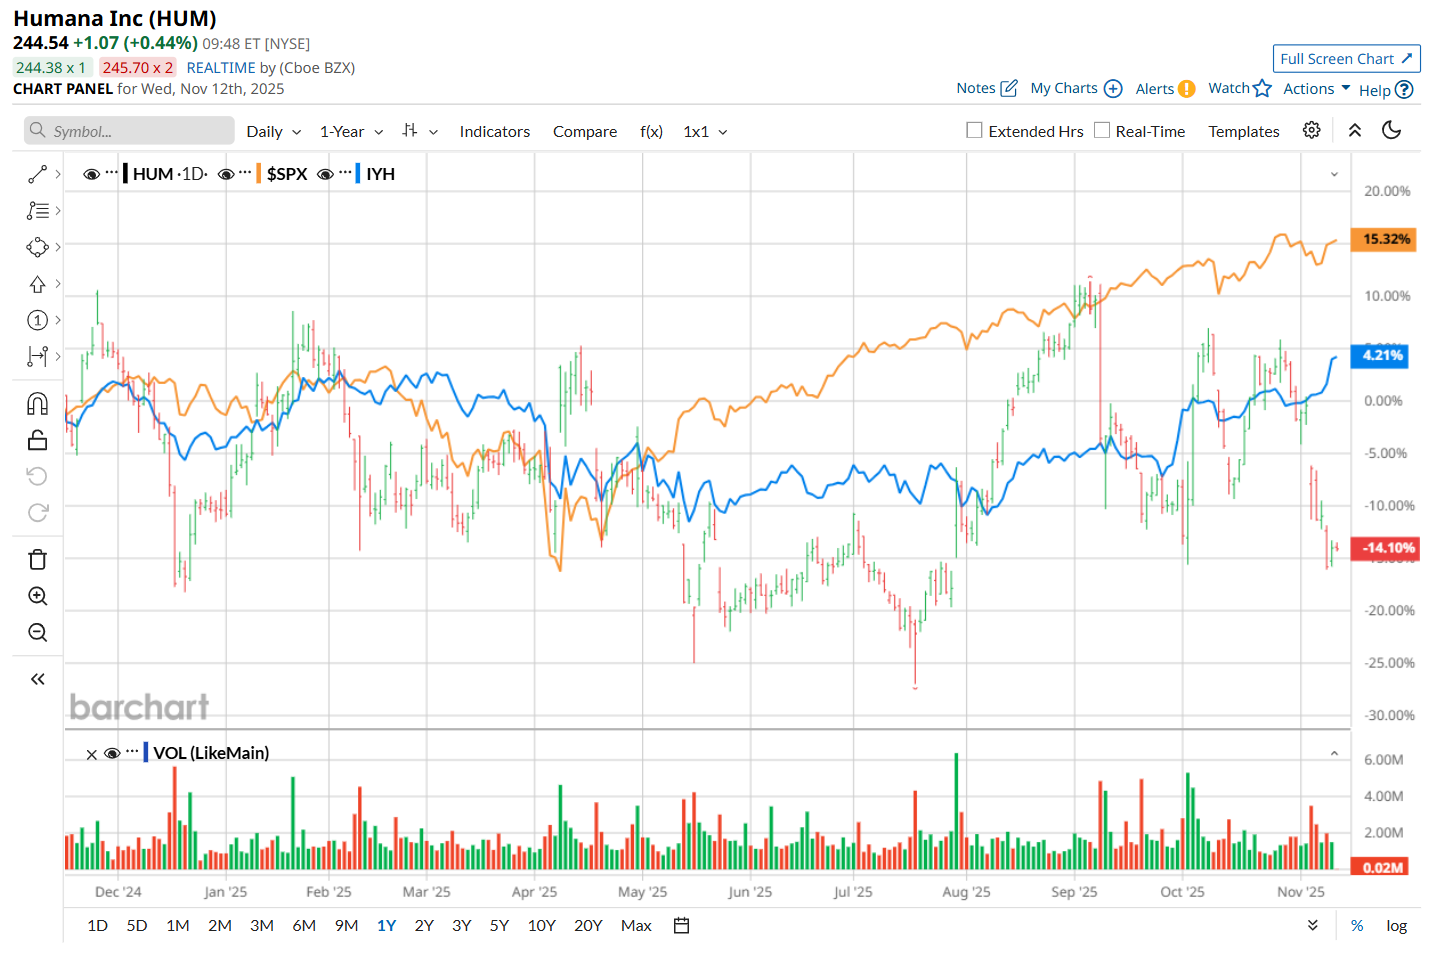
This healthcare company has considerably underperformed the broader market over the past 52 weeks. Shares of HUM have declined 13.1% over this time frame, while the broader S&P 500 Index ($SPX) has gained 14.1%. Moreover, on a YTD basis, the stock is down 4.1%, compared to SPX’s 16.4% return.
Narrowing the focus, HUM has also lagged behind the iShares U.S. Healthcare ETF’s (IYH) marginal uptick over the past 52 weeks and 8.8% YTD rise.
On Nov. 5, shares of HUM plunged 6% after its Q3 earnings release, despite delivering a better-than-expected performance. Both the company’s adjusted revenue of $32.6 billion and adjusted EPS of $3.24 surpassed the consensus estimates. Moreover, its top line climbed 11.4% from the same period last year. However, its bottom line declined 22.1% from the prior-year quarter, raising concerns about declining profitability and narrowing margins, which triggered the sharp sell-off in its stock.
For the current fiscal year, ending in December, analysts expect HUM’s EPS to grow 5.4% year over year to $17.08. The company’s earnings surprise history is mixed. It topped consensus estimates in three of the last four quarters, while missing on another occasion.
Among the 27 analysts covering the stock, the consensus rating is a "Moderate Buy,” which is based on seven “Strong Buy,” two "Moderate Buy,” 17 “Hold,” and one “Strong Sell” rating.
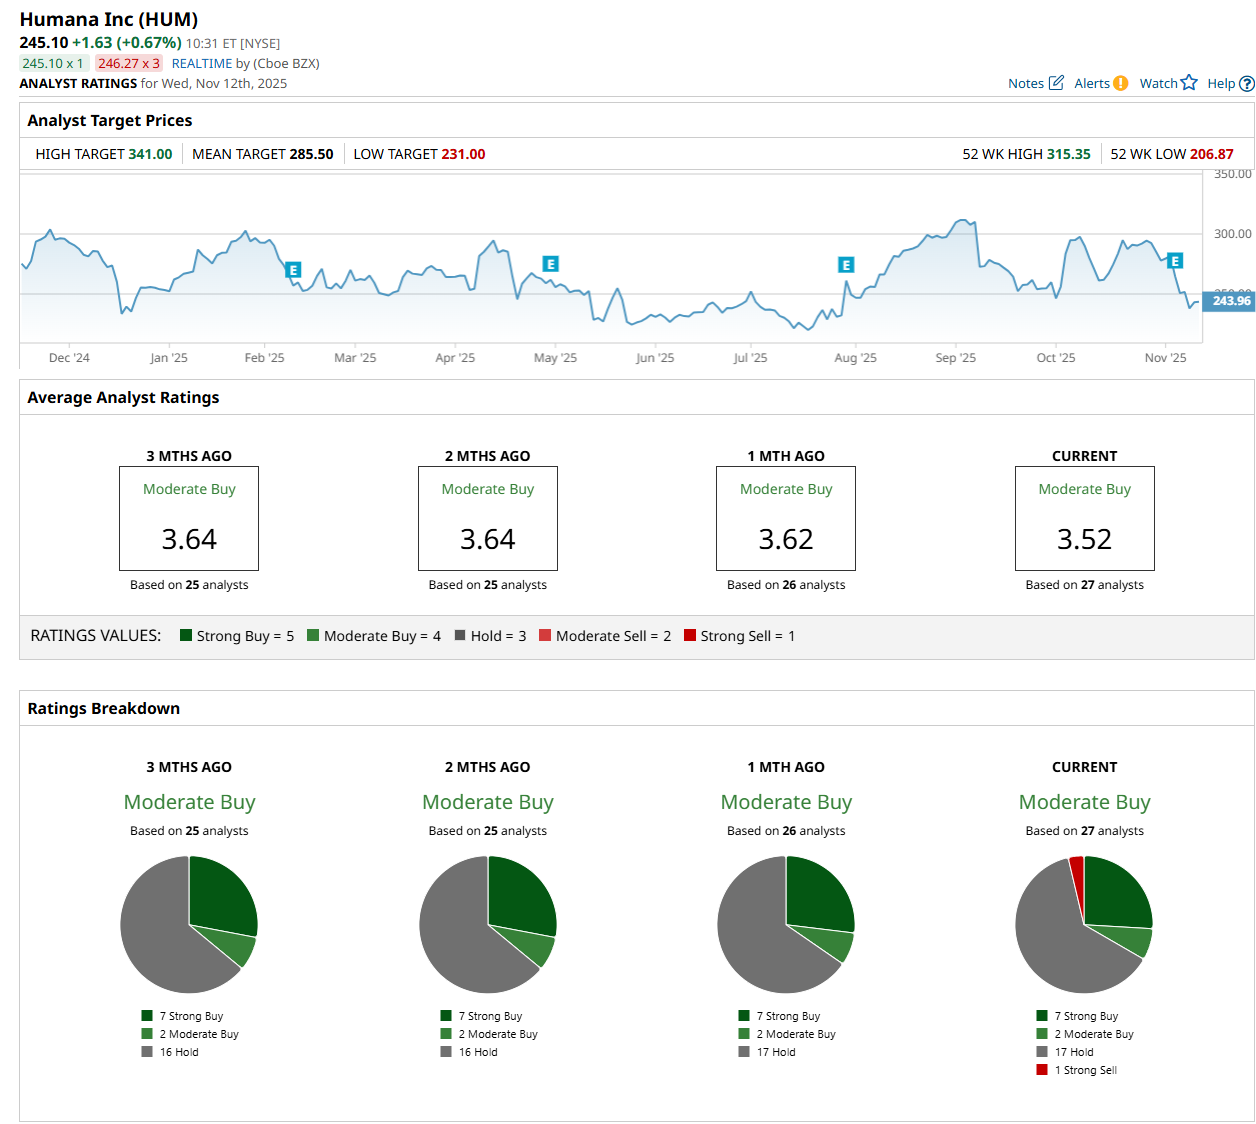
This configuration is less bullish than a month ago, with no analyst suggesting a “Strong Sell” rating.
On Nov. 10, Truist Financial Corporation (TFC) maintained a "Hold" rating on HUM, but lowered its price target to $285, indicating a 16.3% potential upside from the current levels.
The mean price target of $285.50 represents a 16.5% premium from HUM’s current price levels, while the Street-high price target of $341 suggests an upside potential of 39.1%.
On the date of publication, Neharika Jain did not have (either directly or indirectly) positions in any of the securities mentioned in this article. All information and data in this article is solely for informational purposes. For more information please view the Barchart Disclosure Policy here.
More news from Barchart
- As C3.ai Explores a Sale, Should You Buy, Sell, or Hold AI Stock?
- D-Wave’s Contracts Could Be Worth ‘Millions of Dollars.’ Should You Buy QBTS Stock Now?
- Bargain Buy or Risky Bet? Bath & Body Works Slides to 52-Week Low
- Michael Burry Accuses Meta Platforms of ‘Common Fraud’ and Inflated Earnings. Should You Still Buy META Stock Now?