PPG Industries, Inc. (PPG), headquartered in Pittsburgh, Pennsylvania, is a leading global supplier of paints, coatings, and specialty materials. Operating in over 70 countries, PPG serves diverse markets, including construction, automotive, aerospace, industrial, and consumer products.
The company focuses on innovative and sustainable solutions, providing high-performance products that protect and enhance surfaces. With a history dating back to 1883, PPG continues to advance through extensive research and development, delivering trusted products worldwide. The company has a market capitalization of $21.52 billion.
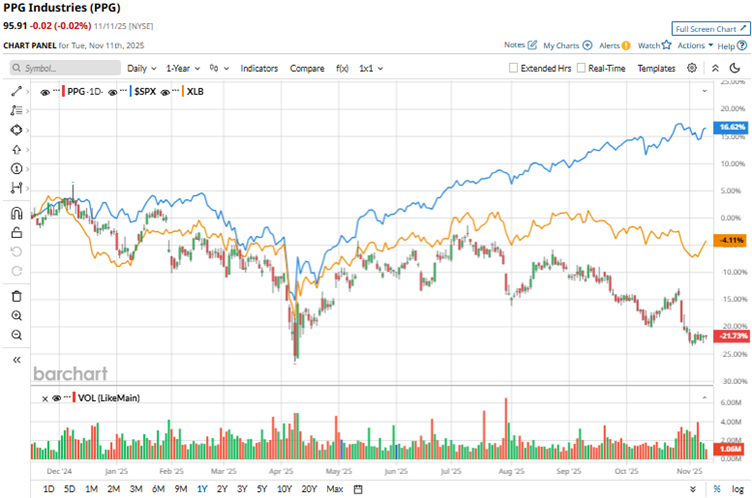
Economic conditions and weakness in the architectural coatings segment have affected PPG’s stock performance. Over the past 52 weeks, the stock has declined by 23.9%, while it is down 12.4% over the past six months. It had reached a 52-week low of $90.24 in April, but is up 6.3% from that level.
The S&P 500 Index ($SPX) has gained 14.1% and 21% over the same periods, respectively, which reflects that the stock is underperforming the broader market. The nature of PPG’s business classifies it as a basic materials stock. Comparing it with the Materials Select Sector SPDR Fund (XLB), we see that the ETF has dropped 6.9% over the past 52 weeks but risen 3.5% over the past six months, outperforming PPG’s stock.
On Oct. 28, PPG reported its third-quarter results for fiscal 2025. In that, the company recorded a modest 1% year-over-year (YOY) increase in its net sales to $4.08 billion, surpassing the Wall Street analysts’ estimate of $4.04 billion. There was an improvement noted in the architectural coatings segment, where net sales also rose by 1% YOY to $1.01 billion.
Meanwhile, sales improvement and aggressive cost management drove a 5% annual growth in the company’s adjusted EPS to $2.13, topping the $2.09 analyst-expected figure. PPG expects its self-help actions to continue driving gains, projecting an adjusted EPS guidance range of $7.60 to $7.70 for the full year 2025.
For the fiscal year 2025, which ends in December 2025, Wall Street analysts expect PPG’s EPS to decline 2.7% YOY to $7.66 on a diluted basis. However, EPS is expected to increase 6.1% annually to $8.13 in fiscal 2026. The company has a mixed history of surpassing consensus estimates, topping them in two of the four trailing quarters, matching them in one instance, and missing in one instance.
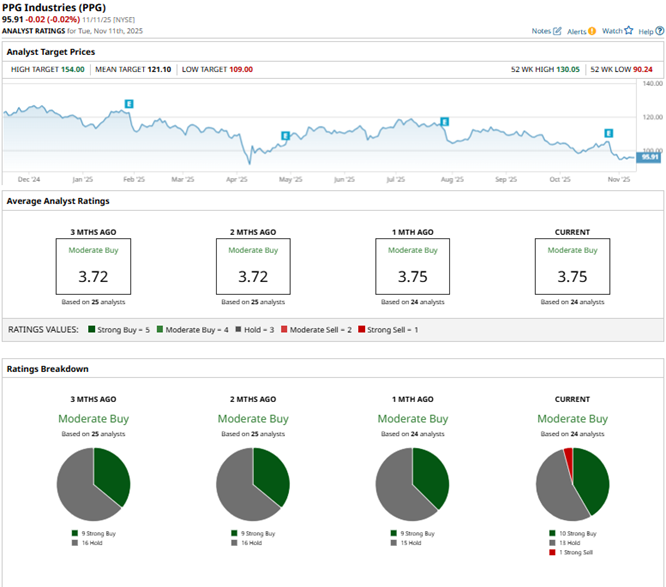
Among the 24 Wall Street analysts covering PPG’s stock, the consensus is a “Moderate Buy.” That’s based on 10 “Strong Buy” ratings, 13 “Holds,” and one “Strong Sell.” The ratings configuration is more bullish than it was a month ago, with 10 “Strong Buy” ratings now, up from nine previously.
Recently, analysts at Evercore ISI Group, led by Stephen Richardson, maintained their “In-Line” rating on PPG’s stock. However, the Evercore ISI analysts also cut the price target from $145 to $112. Last month, Wells Fargo analyst Michael Sison maintained an “Overweight” rating, while lowering the price target from $132 to $130.
PPG’s mean price target of $121.10 indicates a 26.3% upside over current market prices. The Street-high price target of $154 implies a potential upside of 60.6%.
On the date of publication, Anushka Mukherjee did not have (either directly or indirectly) positions in any of the securities mentioned in this article. All information and data in this article is solely for informational purposes. For more information please view the Barchart Disclosure Policy here.
More news from Barchart
- The ‘Largest Value-Creation Event in History’ Could Be Coming for Tesla Stock. Should You Buy Shares Now?
- As Palantir Gets 6M Shares of Surf Air Mobility Stock, Is PLTR or SRFM a Better Buy?
- I’m Preparing for a ‘Bang’ When the Nasdaq Crashes. Here’s How I’m Trading the QQQ ETF First.
- Bullish Tilt: Palantir Option Strategy Geared for Upside Gains