- Insight Molecular Diagnostics (IMDX) is a precision diagnostics company with disruptive transplant technology and strong recent price momentum.
- IMDX has surged 158% over the past year and is trading at a new two-year high.
- Shares maintain a 100% “Buy” opinion from Barchart.
- Analyst sentiment is mixed, with price targets from $4 to $8.
Today’s Featured Stock
Valued at $215 million, Insight Molecular Diagnostics (IMDX) is a precision diagnostics company. The company’s tests are designed to help provide clarity and confidence to physicians and their patients.
The company’s flagship transplant technology quantifies a molecular biomarker known as donor-derived cell-free DNA (dd-cfDNA). Its scientists have played a critical role in developing the science that helped establish dd-cfDNA as a trusted biomarker of transplant rejection, and iMDx is now commercializing that technology.
What I’m Watching
I found today’s Chart of the Day by using Barchart’s powerful screening functions to sort for stocks with the highest technical buy signals; superior current momentum in both strength and direction; and a Trend Seeker “buy” signal. I then used Barchart’s Flipcharts feature to review the charts for consistent price appreciation. IMDX checks those boxes. Since the Trend Seeker signaled a new “Buy” on Oct. 2, the stock has gained 124.85%.
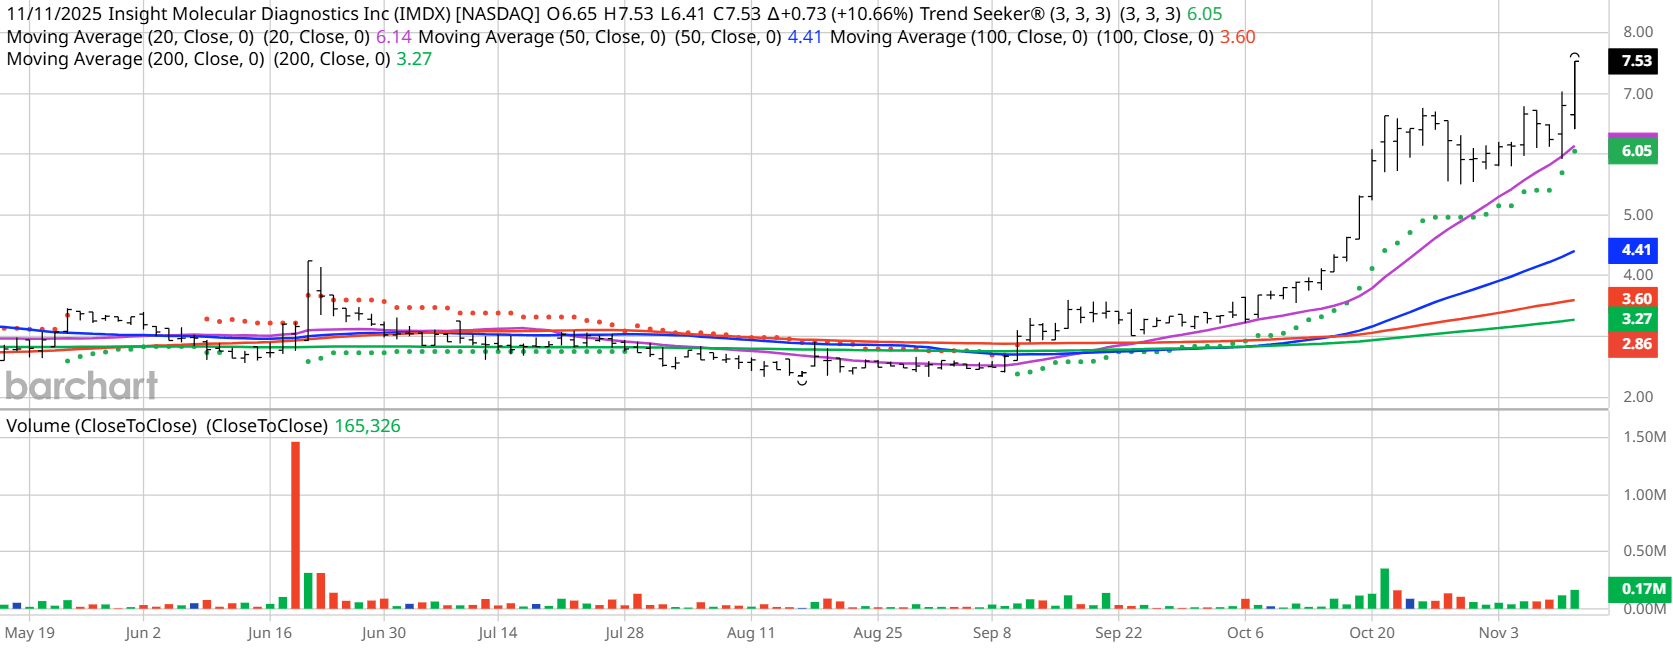
Barchart Technical Indicators for Insight Molecular Diagnostics
Editor’s Note: The technical indicators below are updated live during the session every 20 minutes and can therefore change each day as the market fluctuates. The indicator numbers shown below therefore may not match what you see live on the Barchart.com website when you read this report. These technical indicators form the Barchart Opinion on a particular stock.
Insight Molecular hit a two-year high of $7.75 in morning trading on Nov. 11.
- IMDX has a Weighted Alpha of +87.78.
- Insight Molecular has a 100% “Buy” opinion from Barchart.
- The stock gained 158.33% over the past year.
- IMDX has its Trend Seeker “Buy” signal intact.
- The stock recently traded at $7.68 with a 50-day moving average of $4.51.
- Insight Molecular has made 12 new highs and gained 99.33% in the last month.
- Relative Strength Index (RSI) is at 78.02.
- There’s a technical support level around $6.78.
Don’t Forget the Fundamentals
- $215 million market capitalization.
- Revenue is projected to grow 71.89% this year and another 36.08% next year.
- Earnings are estimated to increase 10.78% this year and an additional 13.87% next year.
Analyst and Investor Sentiment on Insight Molecular Diagnostics
I don’t buy stocks because everyone else is buying, but I do realize that if major firms and investors are dumping stock, it’s hard to make money swimming against the tide.
It looks like Wall Street has a wide range of price targets.
- The Wall Street analysts tracked by Barchart have issued 1 “Strong Buy,” 1 “Moderate Buy,” and 2 “Hold” opinions on the stock with price targets between $4 and $8.
- Value Line rate the stock “Average.”
- CFRA’s MarketScope Advisor rates it a “Sell.”
- Morningstar thinks even with the stock’s recent runup, it’s fairly valued.
- 3,470 investors monitor the stock on Seeking Alpha, which rates the stock a “Hold.”
The Bottom Line on Insight Molecular Diagnostics
As with all medical micro-cap stocks, good news of either being acquired or a scientific breakthrough could send the price through the roof.
The recent price movement could mean someone is predicting that. A recent statement by CEO Joshua Riggs may signal something: “In 2026, with the expected FDA authorization of GraftAssureDx, this is going to change the landscape for transplant patient monitoring by enabling in-house testing at transplant centers.”
Today’s Chart of the Day was written by Jim Van Meerten. Read previous editions of the daily newsletter here.
Additional disclosure: The Barchart of the Day highlights stocks that are experiencing exceptional current price appreciation. They are not intended to be buy recommendations as these stocks are extremely volatile and speculative. Should you decide to add one of these stocks to your investment portfolio it is highly suggested you follow a predetermined diversification and moving stop loss discipline that is consistent with your personal investment risk tolerance.
On the date of publication, Jim Van Meerten did not have (either directly or indirectly) positions in any of the securities mentioned in this article. All information and data in this article is solely for informational purposes. For more information please view the Barchart Disclosure Policy here.
More news from Barchart
- CoreWeave Has a ‘Tremendous Long-Term Opportunity’ But Is Stuck in Limbo Here. Should You Buy, Sell, or Hold CRWV Stock for 2026?
- As C3.ai Explores a Sale, Should You Buy, Sell, or Hold AI Stock?
- D-Wave’s Contracts Could Be Worth ‘Millions of Dollars.’ Should You Buy QBTS Stock Now?
- Bargain Buy or Risky Bet? Bath & Body Works Slides to 52-Week Low


