Royal Caribbean Cruises Ltd. (RCL) operates a global network of ships, delivering memorable travel experiences across popular worldwide destinations. The company’s diverse fleet combines innovation, comfort, and entertainment, offering a range of cruise options tailored to various traveler preferences.
It oversees several leading brands, including Royal Caribbean International, Celebrity Cruises, and Silversea Cruises. With sustainability and guest experience at its core, the company continues to innovate in the modern cruising industry. Royal Caribbean Cruises has its headquarters in Miami, Florida. The company has a market capitalization of $72.26 billion.
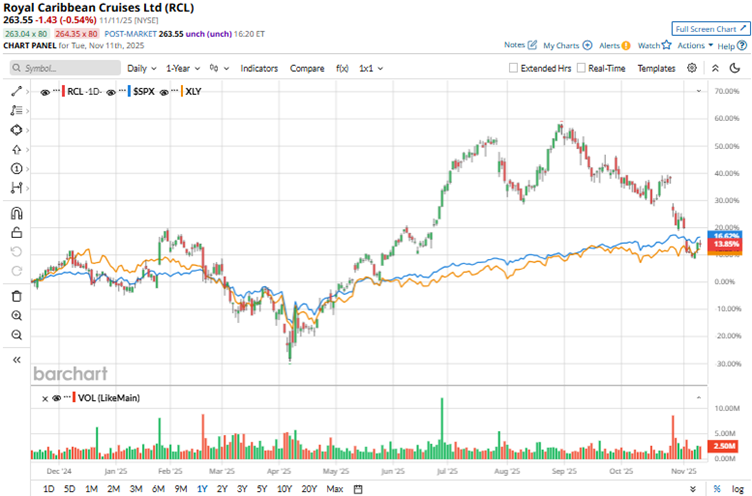
Based on post-pandemic demand for cruising, Royal Caribbean’s stock gained 12.2% over the past 52 weeks. However, recently, the stock has dropped. Over the past three months, the decline was 13%. The stock had reached a 52-week high of $366.50 in August, but is down 28.1% from that level.
The S&P 500 Index ($SPX) has gained 14.1% and 7.4% over the same periods, respectively, which reflects that the stock is underperforming the broader market. The nature of Royal Caribbean’s business classifies it as a consumer discretionary stock. Comparing it with the Consumer Discretionary Select Sector SPDR Fund (XLY), we see that the ETF has risen 9.2% over the past 52 weeks, underperforming RCL’s stock. However, it has gained 6.8% over the past three months, outperforming the stock.
On Oct. 28, Royal Caribbean reported its third-quarter results for fiscal 2025. The company reported higher-than-expected close-in demand and lower costs, which raised its financials. Its total revenues increased 5.2% year-over-year (YOY) to $5.14 billion, missing the Wall Street analysts’ estimate of $5.16 billion.
The company’s capacity for Q3 was up 2.9% YOY, while load factor was 112%. Royal Caribbean’s adjusted EPS was $5.75, up 10.6% from the prior year’s period and higher than the analysts’ estimated $5.68.
Based on these strong results, the company raised its full-year adjusted EPS guidance to a range of $15.58 to $15.63, reflecting 32% YOY growth. Royal Caribbean remains focused on expanding its portfolio of exclusive destinations, enhancing technology integration, and attracting new travelers.
For the fiscal year 2025, which ends in December 2025, Wall Street analysts expect Royal Caribbean’s EPS to grow 32.5% YOY to $15.64 on a diluted basis. Moreover, EPS is expected to increase 14.5% annually to $17.91 in fiscal 2026. The company has a solid history of surpassing consensus estimates, topping them in all four trailing quarters.
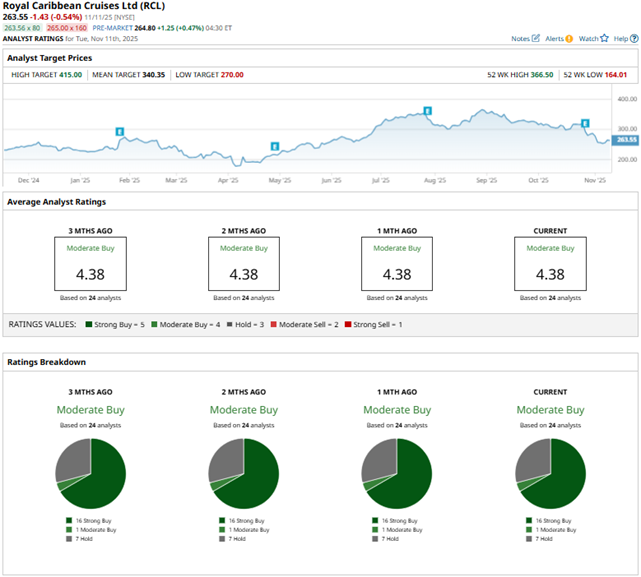
Among the 24 Wall Street analysts covering Royal Caribbean’s stock, the consensus is a “Moderate Buy.” That’s based on 16 “Strong Buy” ratings, one “Moderate Buy,” and seven “Holds.” The ratings configuration has remained the same over the past three months.
Last month, Royal Caribbean’s stock was maintained by Stifel analyst Steven Wieczynski with a “Buy” rating, while lowering the price target from $420 to $400. JP Morgan analyst Matthew Boss also maintained an “Overweight” rating on the stock, while lowering the price target from $367 to $357.
Royal Caribbean’s mean price target of $340.35 indicates a 29.1% upside over current market prices. The Street-high price target of $415 implies a potential upside of 57.5%.
On the date of publication, Anushka Mukherjee did not have (either directly or indirectly) positions in any of the securities mentioned in this article. All information and data in this article is solely for informational purposes. For more information please view the Barchart Disclosure Policy here.
More news from Barchart
- As Palantir Gets 6M Shares of Surf Air Mobility Stock, Is PLTR or SRFM a Better Buy?
- I’m Preparing for a ‘Bang’ When the Nasdaq Crashes. Here’s How I’m Trading the QQQ ETF First.
- Bullish Tilt: Palantir Option Strategy Geared for Upside Gains
- S&P Futures Climb as U.S. Government Shutdown Nears End, Fed Speak on Tap