The Travelers Companies, Inc. (TRV) is a major American insurance provider, delivering property and casualty coverage for individuals, businesses, and organizations across the U.S. and select international markets. Its operations span personal insurance, business insurance, and specialty segments, with a focus on risk management and innovative solutions. The company is headquartered in New York City and is recognized for its broad range of insurance products and services. It has a market capitalization of $63.80 billion.
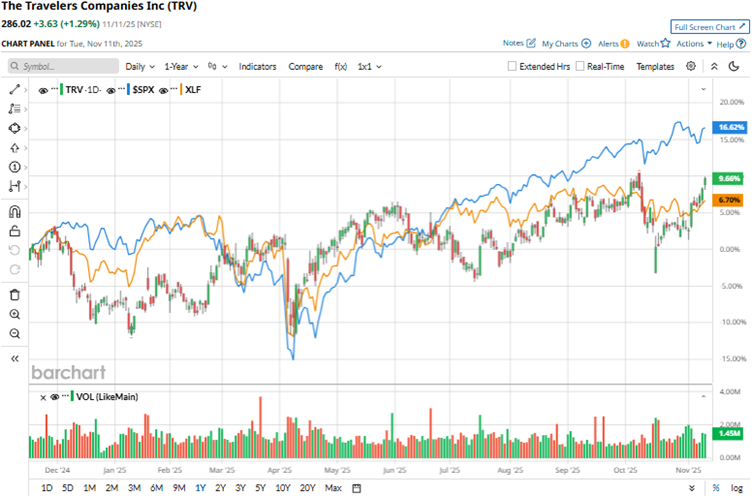
The company’s stable fundamentals have led to the stock rising 10.7% over the past 52 weeks and 6% over the past six months. The stock had reached a 52-week high of $287.95 in October and is only down marginally from that level.
On the other hand, the broader S&P 500 Index ($SPX) has gained 14.1% and 21% over the same periods, respectively, indicating that the stock has underperformed the broader market over these periods. Next, we compare the stock with its own sector. The Financial Select Sector SPDR Fund (XLF) gained 6.7% over the past 52 weeks and the past six months, indicating that the stock has outperformed its sector over the past year but underperformed it over the past six months.
On Oct. 16, TRV reported its third-quarter results for fiscal 2025. The company reported stable gains in its top and bottom-line figures. Its revenue increased 5% year-over-year (YOY) to $12.47 billion, surpassing the $12.34 billion that Wall Street analysts had expected.
TRV’s quarterly core return on equity was 22.6%, six percentage points higher than the prior year’s period. Moreover, lower catastrophe losses, higher underlying underwriting gains, and greater net investment income led to a 55% growth in its core income to $8.14 per share. The bottom-line figure also surpassed the $6.32 per share that Street analysts had expected.
For the fiscal year 2025, which ends in December 2025, Wall Street analysts expect TRV’s EPS to grow 14.5% YOY to $24.71 on a diluted basis. Moreover, EPS is expected to increase 5.9% annually to $26.17 in fiscal 2026. The company has a solid history of surpassing consensus estimates, topping them in all four trailing quarters.
Among the 27 Wall Street analysts covering TRV’s stock, the consensus is a “Moderate Buy.” That’s based on nine “Strong Buy” ratings, one “Moderate Buy,” 15 “Holds,” one “Moderate Sell,” and one “Strong Sell.” The ratings configuration has become more bullish over the past month, with nine “Strong Buy” ratings, up from eight previously.
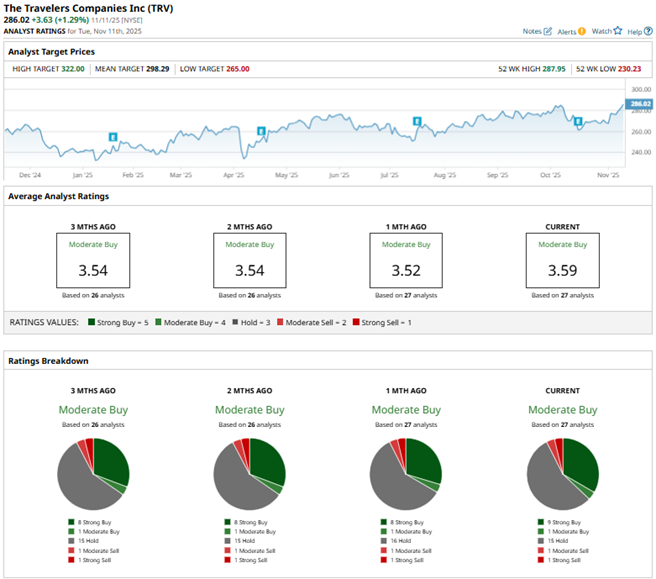
Last month, TRV’s stock price target was raised by analysts at Keefe Bruyette from $304 to $305, while maintaining an “Outperform” rating on the stock, citing that the company’s underwriting strength is not reflected properly in its current valuation. Piper Sandler analysts raised TRV’s price target from $320 to $322, while keeping an “Overweight” rating on the shares following the company’s quarterly results.
TRV’s mean price target of $298.29 indicates a 4.3% upside over current market prices. The Street-high price target of $322 implies a potential upside of 12.6%.
On the date of publication, Anushka Mukherjee did not have (either directly or indirectly) positions in any of the securities mentioned in this article. All information and data in this article is solely for informational purposes. For more information please view the Barchart Disclosure Policy here.
More news from Barchart
- The ‘Largest Value-Creation Event in History’ Could Be Coming for Tesla Stock. Should You Buy Shares Now?
- As Palantir Gets 6M Shares of Surf Air Mobility Stock, Is PLTR or SRFM a Better Buy?
- I’m Preparing for a ‘Bang’ When the Nasdaq Crashes. Here’s How I’m Trading the QQQ ETF First.
- Bullish Tilt: Palantir Option Strategy Geared for Upside Gains


