A little over three months ago, AMD’s high target price was $200, and I discussed how to play it. Last month, the stock broke through $200, and today, AMD trades near $260 and has a high target price of $350.
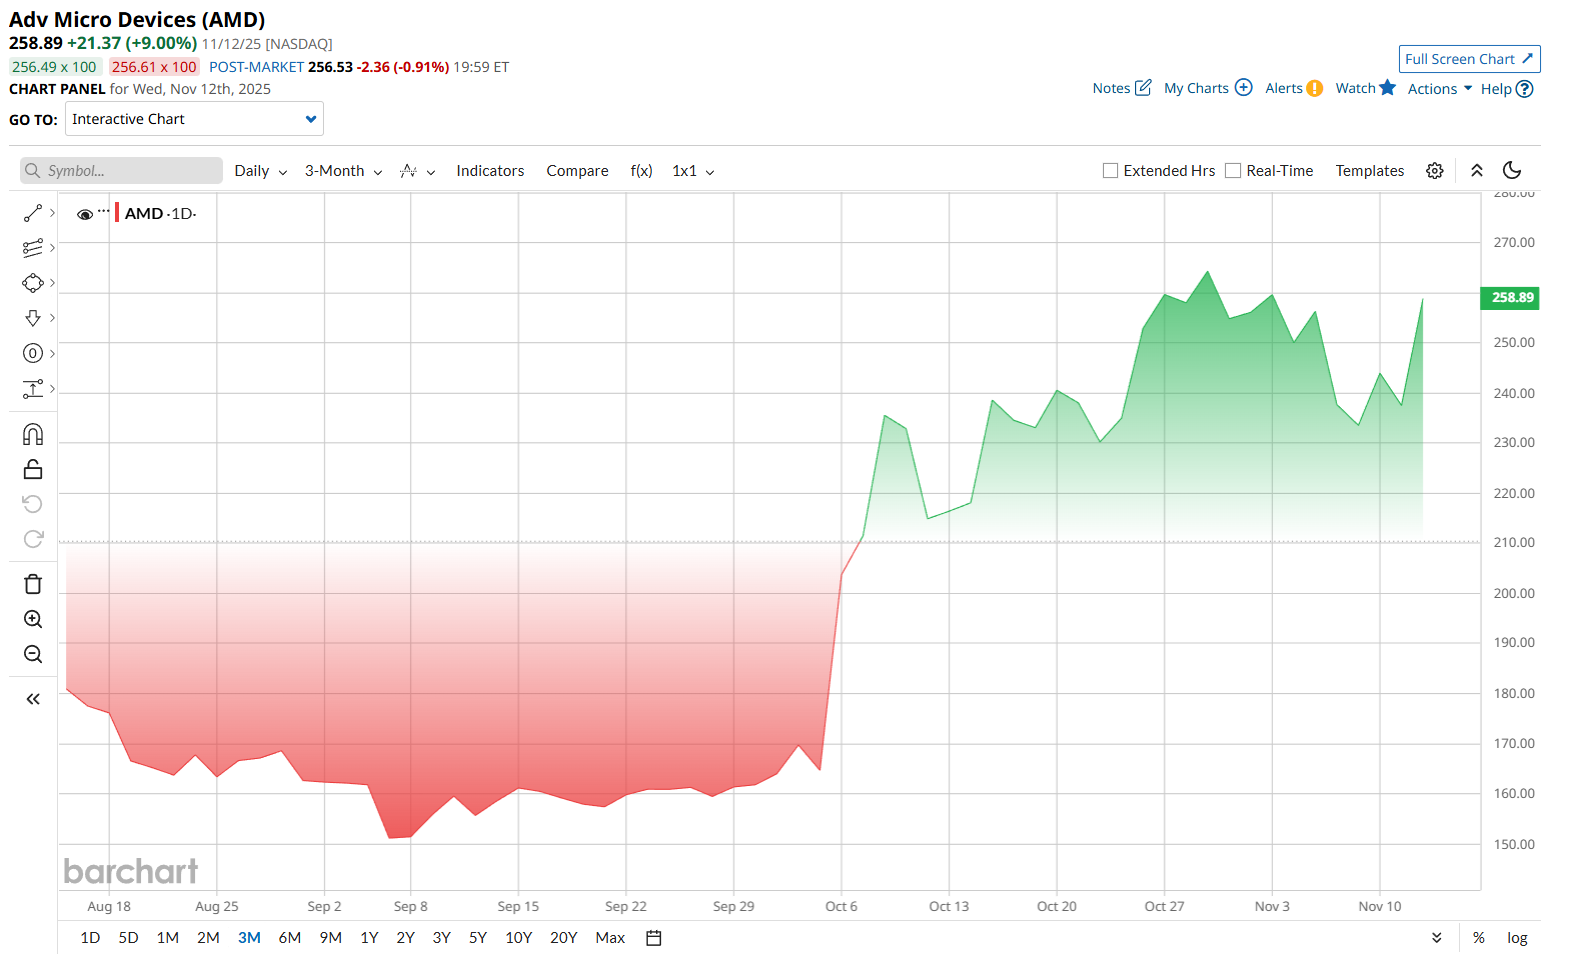
The previous underdog in a three-way competition with Nvidia and Intel before the AI revolution is now one of the primary suppliers of AI chips, with data center revenue expected to increase by 60% annually over the next three years.
And while AMD’s still not as large as Nvidia in terms of market capitalization ($386.7 billion vs. $4.7 trillion), many analysts are bullish on the stock.
Now, typically, I’d think about buying a deep in-the-money call option to capitalize on the renewed bull run. However, with the recent price movements, Q3 financials finally out, and the stock’s volatility profile, I believe this is a better opportunity to sell options.
The Setup: Introduction to Volatility
Before I discuss the actual options strategy itself, let’s clear up why I’m picking it. To do so, here’s a crash course on volatility and why it’s so important in options trading.
Volatility refers to how much the price of an option (premium) changes based on how much the underlying asset’s price is expected to move.
Historical Volatility (HV) indicates how much the stock has moved in the past. On the other hand, implied volatility (IV) is a forward-facing metric that indicates how much the market expects the stock to move. The higher the IV, the higher the option prices, so sellers usually benefit more from this setup.
However, IV is different for every stock. An IV of, say, 90% might be high for one stock but absolutely normal for another. So, you need historical data for comparison.
The good news is, there are several ways to help you analyze that.
One is the IV rank, which measures today’s implied volatility compared to its range over the past year and is displayed as a percentage, ranging from 0% to 100%. In plain English, it shows if options are expensive or cheap based on comparative historical data.
With 50% at the mid-point, anything above means premiums are elevated, while anything below means premiums are relatively cheaper.
Lastly, IV percentile shows how often the current IV has been lower than today’s level over the past year. The closer it is to 100%, the higher the option prices are compared to most of the year.
Now, let's have a look at AMD’s volatility profile.
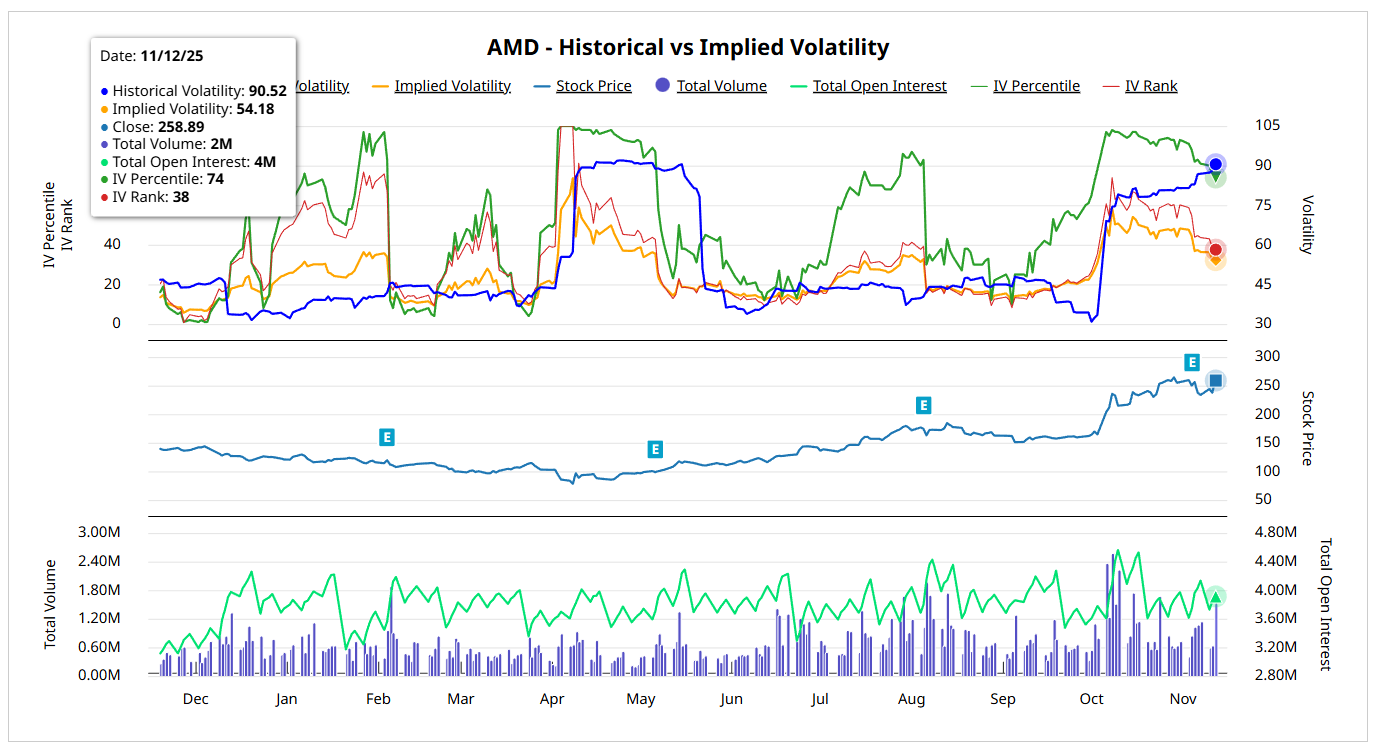
As you can see, HV (blue line) is high, while IV (yellow line - 54%) and IV rank (red line - 38%) are on the way down. Meanwhile, the IV percentile is at 74%, indicating that volatility is higher than in 74% of the year.
Together, these indicate still higher premiums - but that’s changing fast.
A quick glance at the new Profit & Loss chart also indicates that volatility is falling.
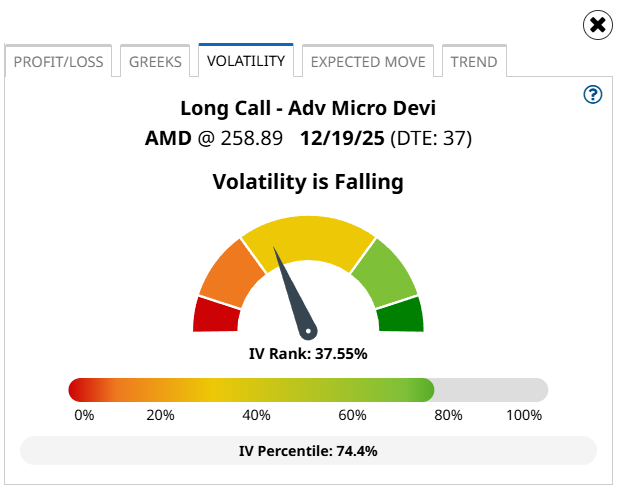
Overall, this means that AMD has recently experienced significant price moves, but the market is now expecting smaller movements.
So with higher premiums and falling volatility, the setup is favorably skewed towards option sellers.
And since you’re bullish on the stock, a bull put is a perfect choice.
The Strategy: Bull Put Spread
A bull put, also known as a short put spread or put credit spread, is a strategy that involves selling a put option and buying another put at a lower strike price, with the same underlying asset and expiration date. As the name implies, the trade starts with a net credit.
A bull put is used for a neutral to moderately bullish market outlook. The goal is for the stock to trade above the short put strike. If that happens, both options expire worthless, and you keep the entire net credit.
However, if the stock trades below the lower long strike, your short put will be in the money, and your trade will end at a maximum loss. This is calculated by taking the difference between the two strikes, less the net credit received.
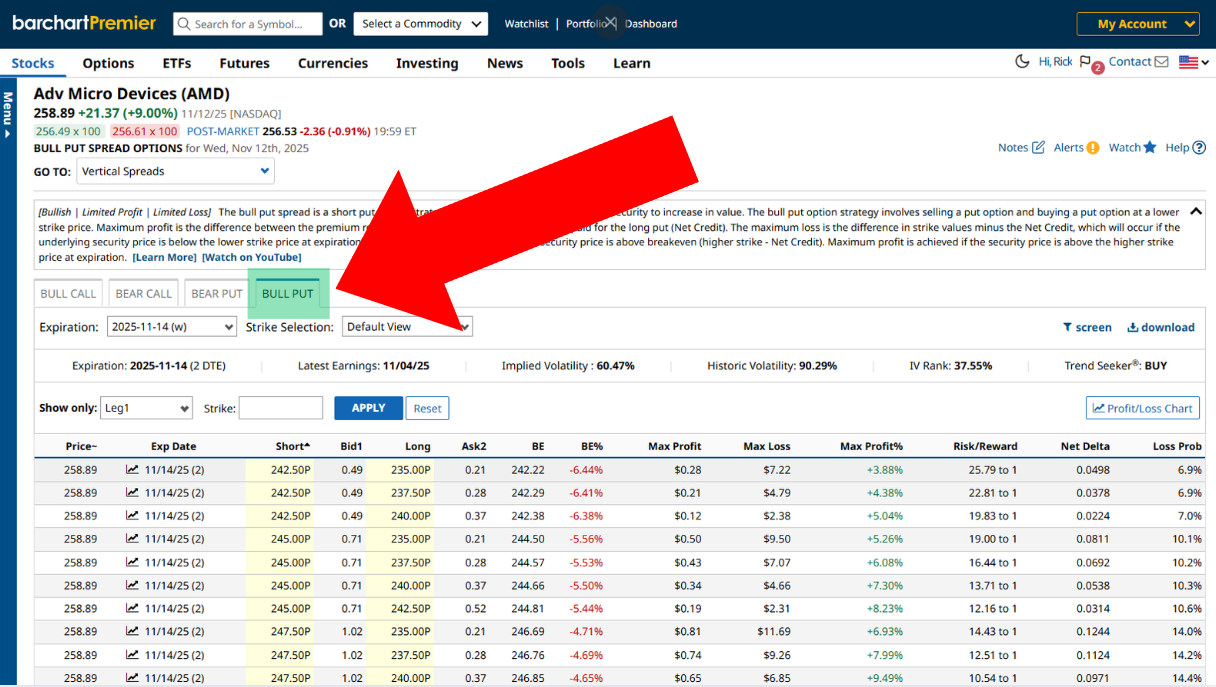
To find bull put trades, go to the Vertical Spreads section from the Stock Profile page.
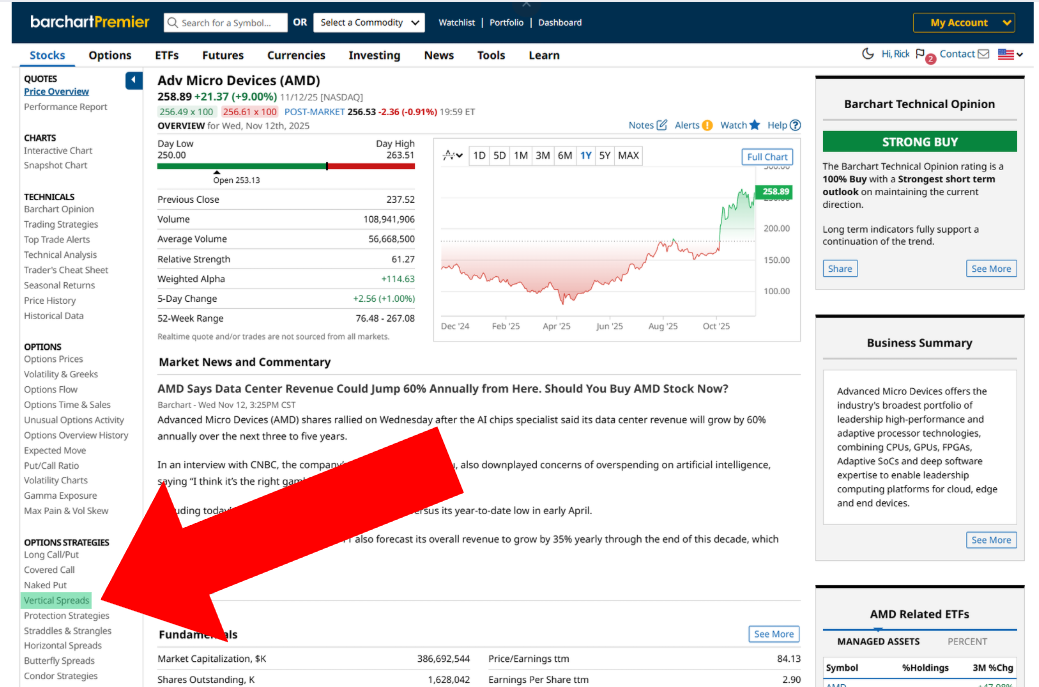
Then click the Bull Put tab.
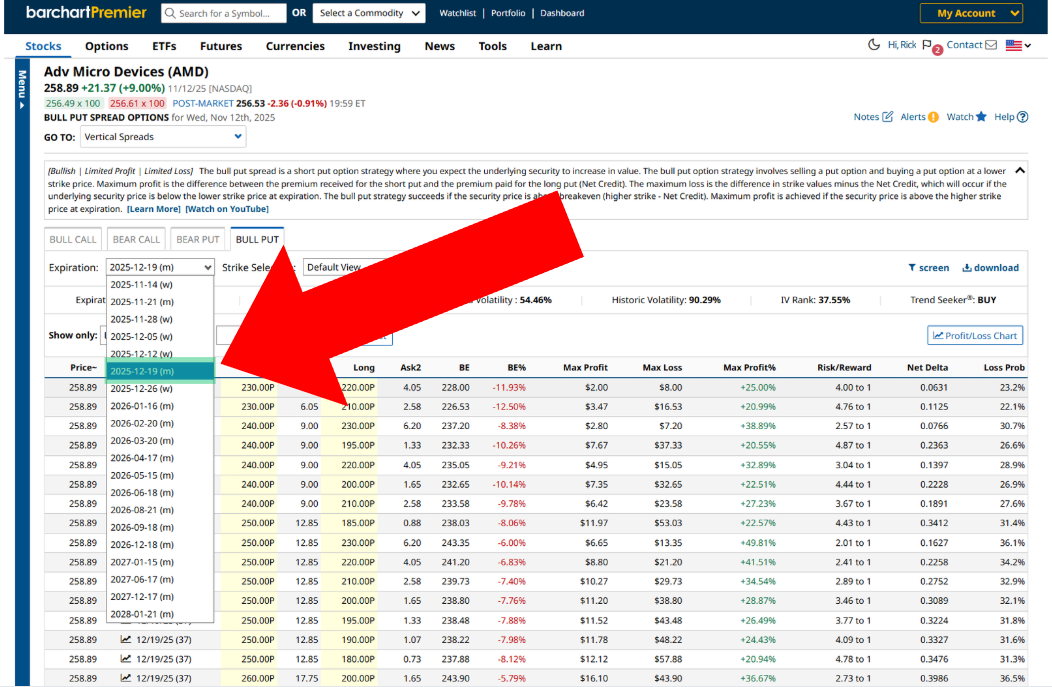
When I’m selling options, I typically opt for trades with 30-45 days to expiration (DTE). So, I’ll change the expiration date to December 19, 2025, which is 37 days away.
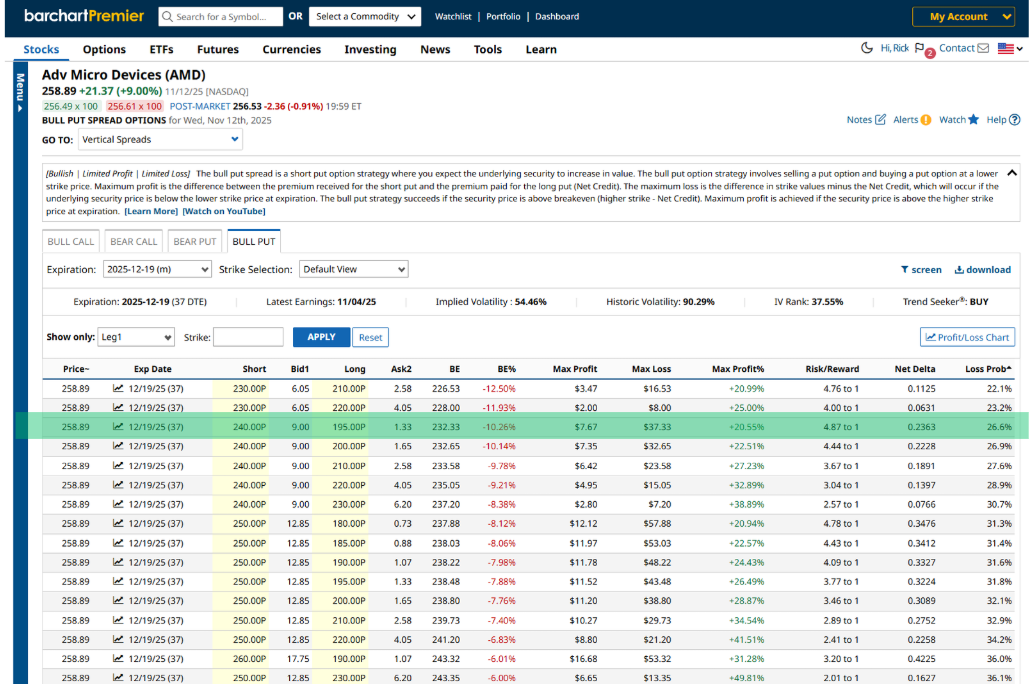
For bull puts, the option screener shows loss probability in the very last column. Usually, I pick trades that have a 20% chance of loss, but since we don’t have any, I’ll extend the range to 30% and choose the trade with the highest max profit. In this case, it’s the third one:
Trade Details
According to the screener, you can sell a 240-195 bull put spread on AMD. You’ll receive $9 for the 240-strike short put and pay $1.33 for the 195-strike long put, resulting in a $7.67 per share net credit, or $767 per contract. The trade has a roughly 27% chance of ending at a loss, which is decent odds.
If AMD continues to trade above $240 by December 19, you get to keep the entire premium. However, if AMD falls below $190 by expiration, your trade will end at a loss, calculated by:
- ((Difference Between Strike Prices) - Net Credit Per Share) * 100 = Maximum Loss
- (($240 - $195) - $7.67) * 100 = Maximum Loss
- = $3,733 maximum loss per contact
If the trade ends favorably (with a loss probability of only 26.6%), then there's nothing more to do. Otherwise, you can reassess your outlook and adjust the trade amid AMD’s current volatility profile to choose a strategy that aligns with your investment thesis.
Final Thoughts
Selling a bull put spread is an excellent income-generating strategy when you’re moderately bullish on the stock and don’t have enough or are unwilling to part with the required capital to buy a call outright. However, your profit potential will be capped, so consider your overall outlook when choosing your strategy.
Lastly, it’s always a good idea to close your short trades before expiration, even if there’s a small chance of a massive price swing. Remember, consistent and profitable trading is built on discipline and risk management.
On the date of publication, Rick Orford did not have (either directly or indirectly) positions in any of the securities mentioned in this article. All information and data in this article is solely for informational purposes. For more information please view the Barchart Disclosure Policy here.
More news from Barchart
- United Airlines (UAL): Hidden Behind the Shutdown Deal is a Secret Informational Arbitrage Opportunity
- AMD’s $350 Price Target Is In: This Options Trade Is the Data-Driven Winner
- Double Your Dividends with this Options Strategy on Omega Healthcare
- 4 Reasons to Roll Your Covered Call Option and Keep Your Income Strategy Alive