In my October 21 Barchart article, which recapped the price action in grain and oilseed markets in Q3, I highlighted the 2.2% decline in the nearby CBOT soybean futures market in Q3 and the 0.35% gain over the first nine months of 2025. The bean futures settled Q3 at just over $10 per bushel when I concluded:
At the current levels, prices have limited downside potential, while the upside could be substantial. I favor long positions in the sector, leaving plenty of room to add on further declines over the coming months. The 2026 crop year and supply uncertainty are just around the corner in early 2026, which could ignite price recoveries.
The soybean futures surpassed the $11 per bushel level in late October, following the end of the 2025 crop year.
Soybeans turn higher after the 2025 crop year
After reaching only 29.75 cents below the 2012 record high in February 2022, soybean futures prices plunged 46.2% from $17.5925 to the late 2024 $9.47 per bushel low on the continuous CBOT futures contract.
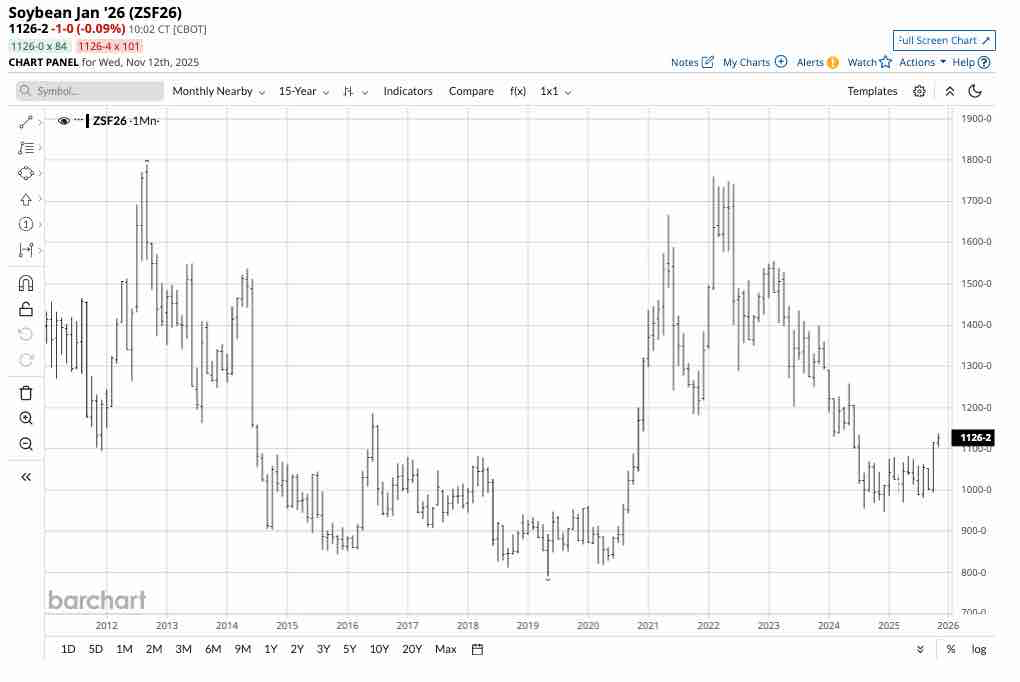
The monthly chart shows that the nearby soybean futures contract remained near its lows from January through September 2025, spanning the planting, growing, and harvest seasons of the 2025 crop year. While supplies were ample to meet the global requirements, U.S. tariffs on China, the leading soybean consumer, depressed U.S. prices as China did not purchase U.S. beans, instead buying their requirements from Brazil.
U.S. trade talks with China caused the rally
In October, trade talks between the U.S. and China, along with a meeting between Presidents Trump and Xi, resulted in a temporary agreement on tariffs that opened the door for China to purchase U.S. oilseeds.
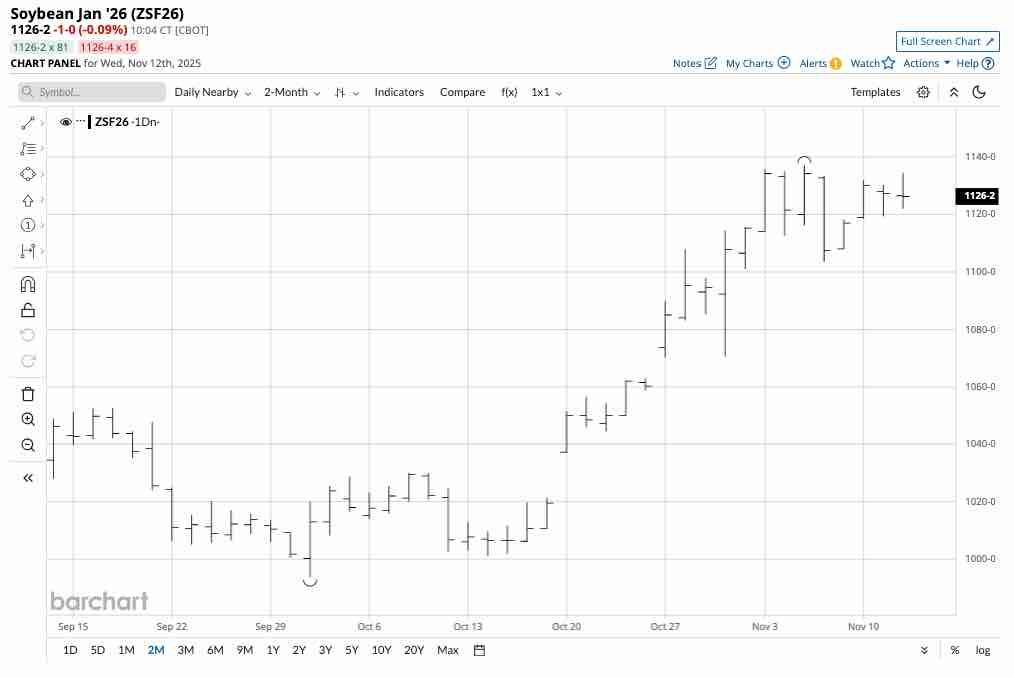
The two-month chart highlights the 14.4% rally in the continuous soybean futures contract from $9.9375 on October 1 to the latest high of $11.37 per bushel on November 5.
No WASDE, but the price action tells the story
Each month, the U.S. Department of Agriculture releases its World Agricultural Supply and Demand Estimates Report, which is the gold standard for agricultural supply and demand data.
The U.S. government shutdown prevented the release of the October report, which left the market in the dark from a fundamental perspective. However, the price action indicates that the trade issues between the U.S. and China were a significant factor in depressing soybean futures prices.
Meanwhile, the next WASDE report is scheduled for Friday, November 14. According to the USDA website:
NOTE TO USERS: Starting October 1, 2025, the World Agricultural Supply and Demand Estimates report (WASDE) archive will transition from the Mann Library to the National Agricultural Library. All historical data and reports currently hosted on the Mann Library site will remain fully accessible through the National Agricultural Library’s platform.
When the November WASDE report is released on Friday, November 14, at noon EST, it should reflect a more positive price forecast, given the potential for Chinese bean purchases from the United States.
Meanwhile, a critical factor for the path of least resistance of soybean futures prices over the coming weeks and months will be the 2025/2026 Brazilian crop before the United States moves into next year and the 2026 crop year in the Northern Hemisphere.
Levels to watch in the CBOT soybean futures market
After trading in a narrow range of just below $9.70 and just above $10.80 from January through September 2025, soybean futures broke out to the upside in October.
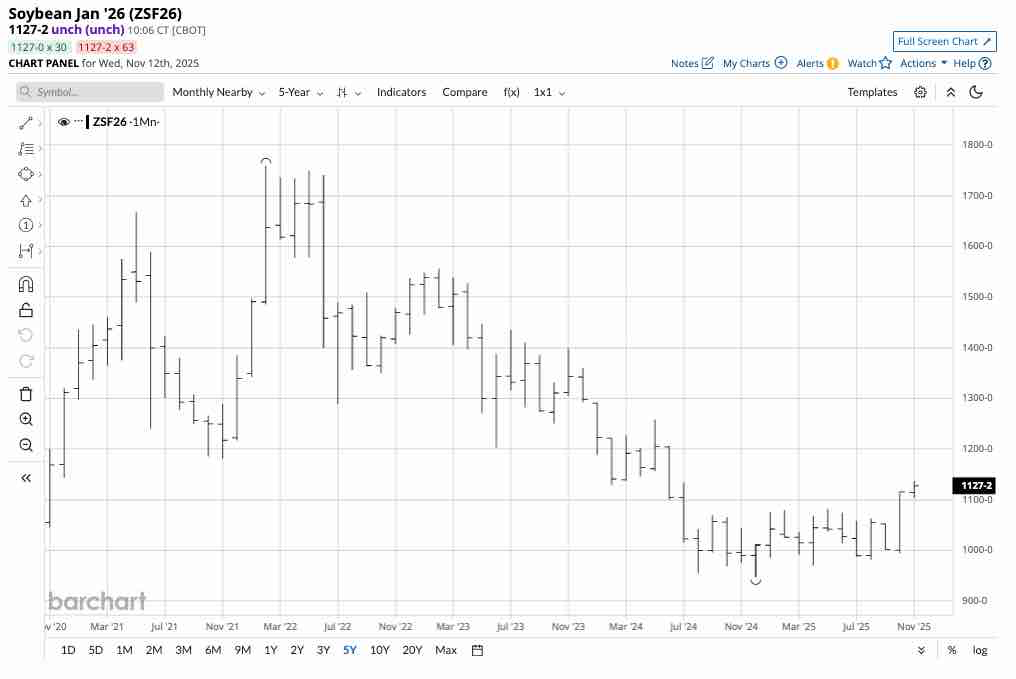
The monthly continuous futures contract highlights that critical technical support is at the December 2024 low of $9.47, with the first technical resistance level at the May 2024 high of $12.5825 per bushel. A break above the May 2024 high would end the bearish trend since the 2022 high.
SOYB on price weakness for the 2026 crop year
Soybean prices were at low levels from August 2024 through September 2025. Inflationary pressures have increased production costs over the past years, causing economic woes for soybean farmers. Therefore, farmers could plant fewer soybeans over the coming months, given the depressed prices. Commodity cyclicality suggests that bear markets cause prices to fall to levels where production slows, inventories decline, consumers increase purchases, and prices find bottoms. Time will tell if the December 2024 low of $9.47 per bushel marks a significant bottom for the soybean futures market, and the price will continue to make higher lows and higher highs over the coming months.
The most direct route for risk positions in soybeans is the futures and futures options on the CME’s CBOT division. Each soybean futures contract contains 5,000 bushels. At $11.30 per bushel, the contract value is $56,500. The CBOT’s original margin requirement is $2,200, meaning a market participant can control one soybean futures contract on the long or short side, for a nominal 3.89% down payment. If equity on a risk position falls below $2,000 per contract, the exchange requires maintenance margin payments.
At $23.35 per share, the Teucrium Soybean ETF (SOYB) had $46.72million in assets under management. SOYB trades an average of over 160,000 shares daily. According to the Teucrium website, SOYB charges an expense ratio of 0.83%.
SOYB holds three actively traded CBOT soybean futures contracts, excluding the nearby contract to mitigate roll risks. Since the most speculative activity occurs in the nearby contract, SOYB tends to underperform the nearby soybean futures on a percentage basis on the upside, but it often outperforms the nearby contract when soybean prices decline.
The most recent rally took the January 2026 CBOT soybean futures 12.3% higher from $10.1250 on October 1 to $11.37 per bushel on November 5.
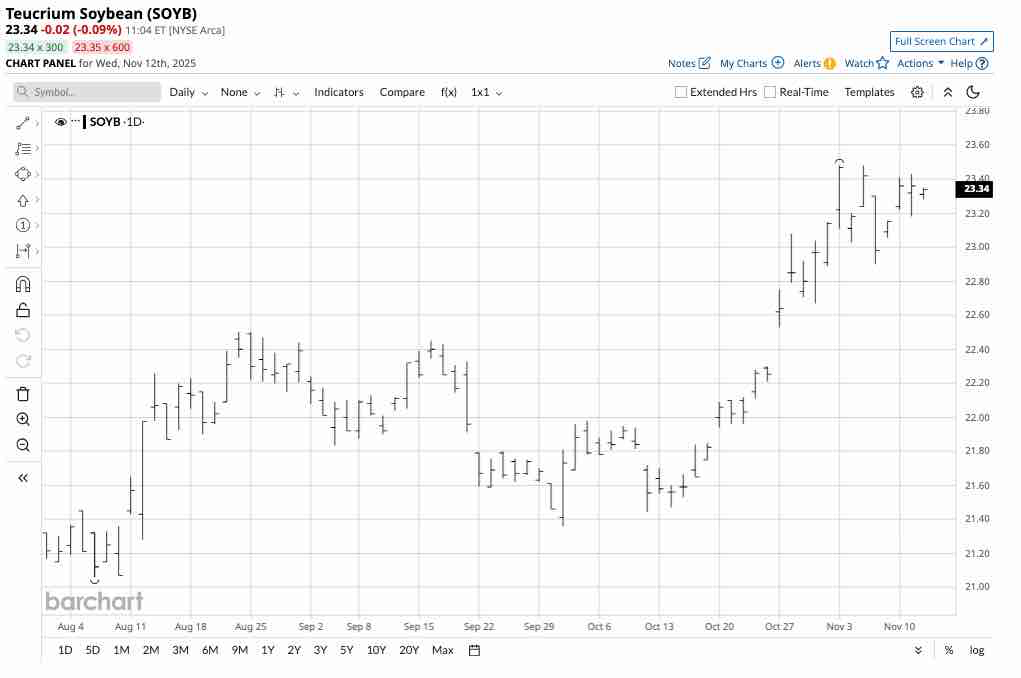
Over the same period, the SOYB ETF moved higher by 9.93% from $21.36 to $23.48 per share. SOYB slightly underperformed the January futures because the ETF holds three deferred CBOT soybean futures contracts.
Soybean futures have room to rally before reaching the critical technical resistance level at over $12.50 per bushel. Uncertainty over the Brazilian 2025/2026 crop and the 2026 crop year in the Northern Hemisphere could cause the rally to continue. Chinese soybean purchases from the United States are not bearish for the oilseed futures. I favor a scale-down approach to accumulating soybean exposure on price weakness over the coming weeks.
On the date of publication, Andrew Hecht did not have (either directly or indirectly) positions in any of the securities mentioned in this article. All information and data in this article is solely for informational purposes. For more information please view the Barchart Disclosure Policy here.