Valued at a market cap of $129.2 billion, Deere & Company (DE) manufactures agricultural, construction, forestry, and turf equipment. The Moline, Illinois-based company also provides precision agriculture technologies, parts, and financial services to support its machinery operations.
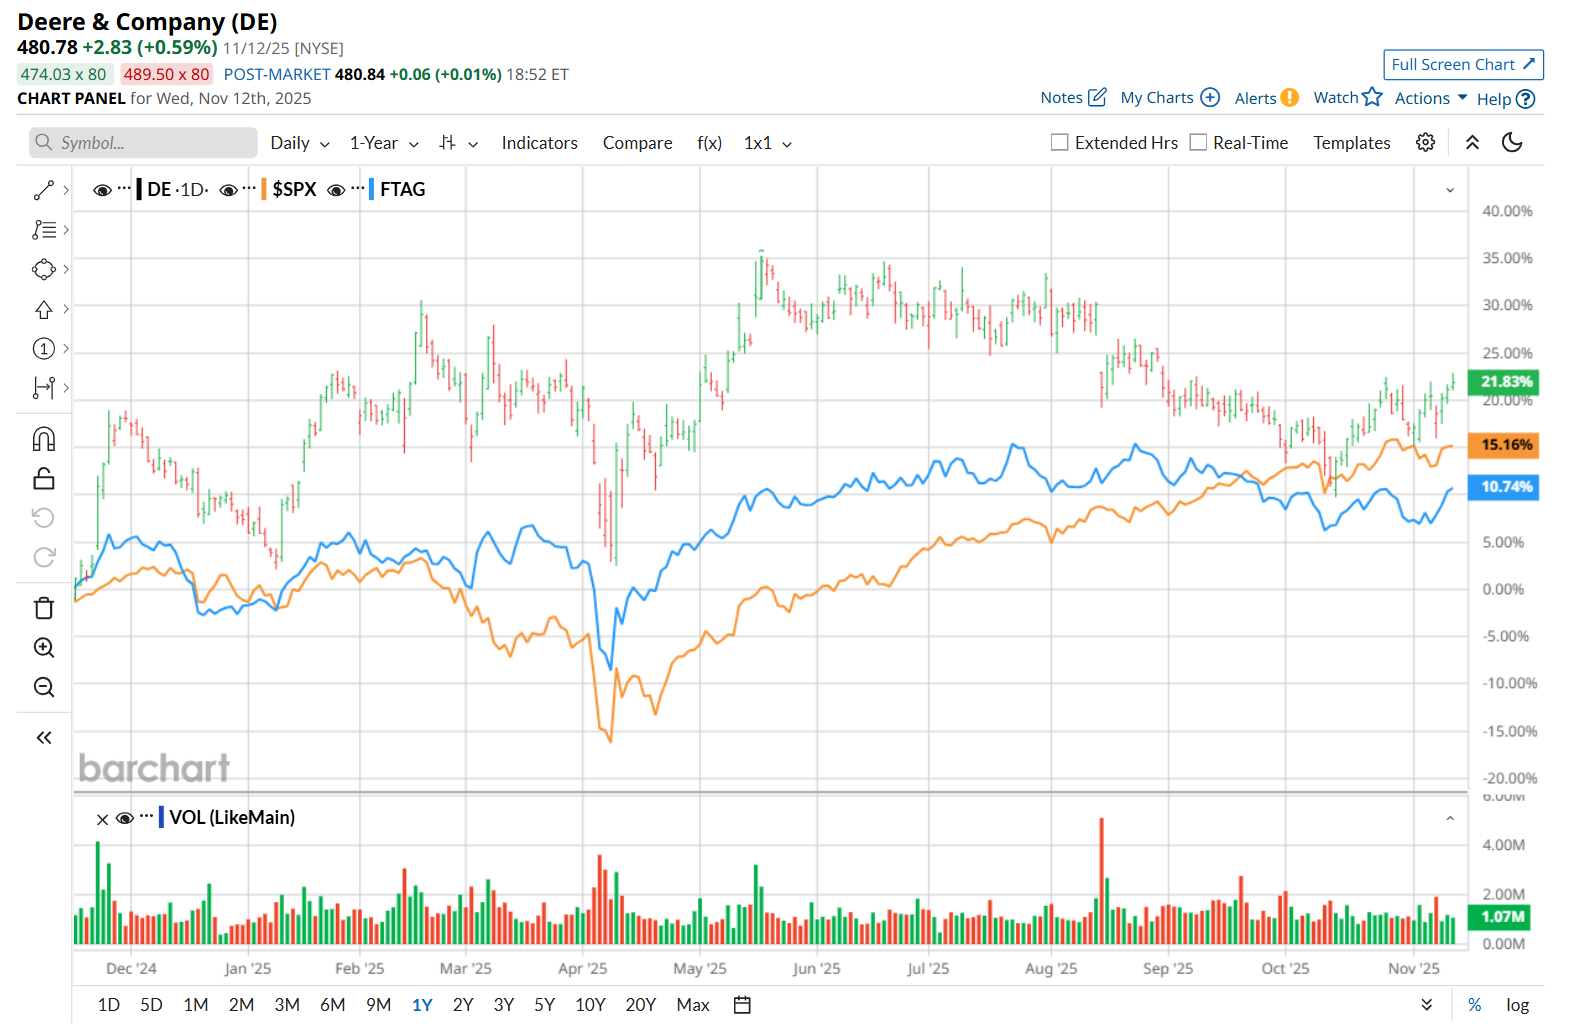
This agricultural equipment manufacturer has outpaced the broader market over the past 52 weeks. Shares of DE have rallied 22.1% over this time frame, while the broader S&P 500 Index ($SPX) has gained 14.5%. However, on a YTD basis, the stock is up 13.5%, lagging behind SPX’s 16.5% return.
Zooming in further, DE has outperformed the First Trust Indxx Global Agriculture ETF’s (FTAG) 10.1% uptick over the past 52 weeks and 12.7% YTD rise.
Despite reporting better-than-expected Q3 results on Aug. 14, shares of DE plunged 6.8% that day. Both its revenue of $12 billion and EPS of $4.75 outpaced the analyst estimates. However, the company’s net sales fell across all major segments, led by a notable 16.2% drop in the Production & Precision Agriculture division, which might have made investors jittery. Overall, compared to the year-ago quarter, its revenue was down 8.6%, while net income per share slid 24.5%. DE also narrowed its fiscal 2025 net income guidance, citing a challenging operating environment. Additionally, high interest rates and trade uncertainties have weakened equipment demand, particularly in North America, further weighing on investor sentiment.
For the current fiscal year, which ended in October, analysts expect DE’s EPS to decline 27.5% year over year to $18.57. The company’s earnings surprise history is promising. It exceeded the consensus estimates in each of the last four quarters.
Among the 23 analysts covering the stock, the consensus rating is a "Moderate Buy,” which is based on 11 “Strong Buy,” two "Moderate Buy,” nine "Hold,” and one “Strong Sell” rating.
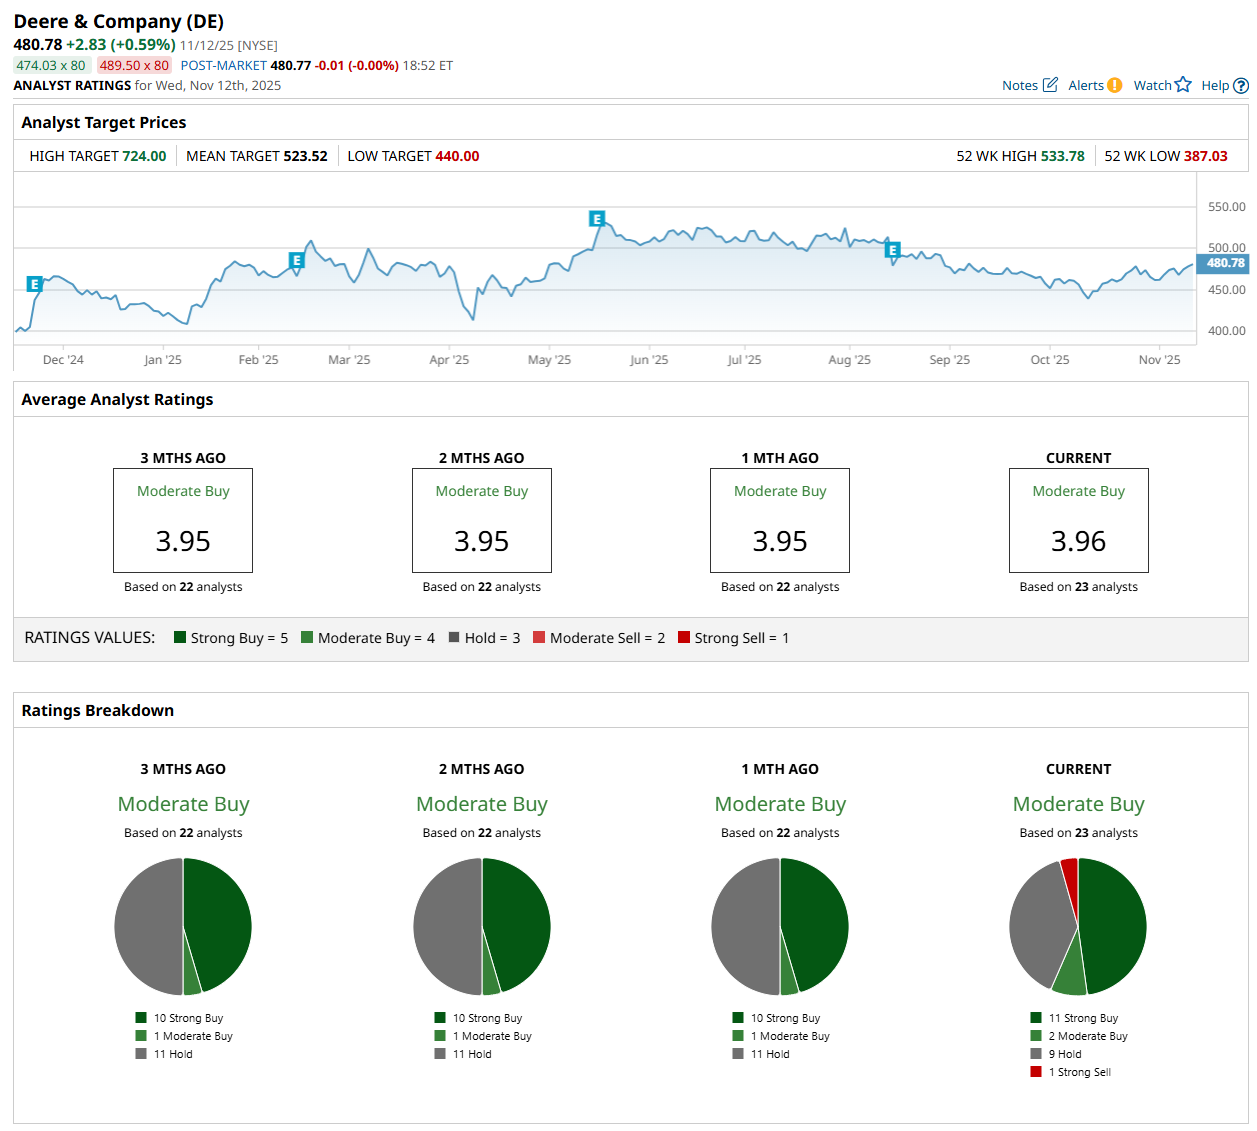
This configuration has changed since a month ago, with 10 analysts suggesting a “Strong Buy” rating and none recommending a "Strong Sell.”
On Oct. 28, Adam Seiden from Barclays PLC (BCS) maintained a “Buy” rating on DE, with a price target of $530, indicating a 10.2% potential upside from the current levels.
The mean price target of $523.52 represents an 8.9% premium from DE’s current price levels, while the Street-high price target of $724 suggests an ambitious 50.6% potential upside from the current levels.
On the date of publication, Neharika Jain did not have (either directly or indirectly) positions in any of the securities mentioned in this article. All information and data in this article is solely for informational purposes. For more information please view the Barchart Disclosure Policy here.
More news from Barchart
- Double Your Dividends with this Options Strategy on Omega Healthcare
- Does the Spindle AI Acquisition Make Salesforce Stock a Buy, Sell, or Hold?
- Stocks Muted Before the Open as Investors Weigh Fed Rate Outlook After U.S. Reopens
- Is This Dividend Stock a Buy for 2026 After More Than Doubling This Year?