Thanks to brewing momentum in Washington to end the political gridlock that contributed to the U.S. government shutdown, the equities market broadly settled higher. However, among the biggest beneficiaries were United Airlines (UAL) and its sector peers. Following a significant disruption to air travel, investors previously fretted about a sustained dark cloud ahead of the holiday season. But with that headwind potentially avoided, UAL stock swung northward.
Of course, the issue now is that the news has largely been baked into company valuations. While UAL stock popped more than 5% on Wednesday, the afterhours session saw the equity slip about half a percent. Moving forward, UAL and its ilk will need new information to justify continued optimism. From the perspective of quantitative analysis, though, the prevailing winds may favor a bullish posture.
By definition, quant analysis involves the study of empirical price behaviors to identify asymmetrical inefficiencies that can potentially be exploited. While this sounds like technical analysis, the two methodologies are epistemologically divergent. Indeed, one of the key flaws of the technical approach (along with the fundamental) is authorial contingency; basically, the viability of the model depends almost entirely on the person making the claim.
Stated differently, two technical analysts can look at the same chart and come up with five different interpretations. It’s the same flaw with the fundamental methodology. You’ll notice that the spread between the high and low analyst price targets of UAL stock is a whopping 97.5%. That’s clear evidence that the concept of “intrinsic value” is opinion-driven, not objective.
In contrast, in the quant ecosystem, so long as everyone agrees to the mechanical ruleset, the calculations and derived outcomes are universally consistent. This dynamic demonstrates that the quant approach is independent of the author making the claim.
To be fair, data independence alone doesn’t mean that quant models are foolproof. Since the market is an open system, exogenous factors can easily create unexpected distortions. However, the argument is that over enough trials, public securities — especially heavily traded ones like UAL stock — exhibit recurring, clustered patterns.
It’s the anticipation of these patterns that fuels quant-based models.
Exploiting a Potentially Favorable Inefficiency in UAL Stock
While fully explaining the mechanics of quant systems would take hundreds of pages, the unifying foundational principle typically involves probabilistic distributions using Kolmogorov-Markov frameworks and smoothed over with kernel density estimations (KDE). Essentially, a quant is looking for two distributions: a standard expectation of outcomes and the outcomes expected under the specific circumstance at hand.
Only where there is a favorable variance relative to the baseline does the trader act on the data. Otherwise, they would keep searching for opportunities until an idea pops up that matches a compelling risk-reward profile.
While talking about Kolmogorov-Markov frameworks and KDEs sounds complicated, it’s really no different than shortstops adjusting their position relative to the opposing batters' spray patterns. At the highest level of baseball, every facet of the game is heavily analyzed. As such, players adjust their positioning and tactics accordingly.
So, why should options trading be any different?
Using the framework mentioned above, the forward 10-week median returns of UAL stock can be arranged as a distributive curve, with outcomes ranging between $93 and $100.20 (assuming an anchor price of $94.95, Tuesday’s close). Further, price clustering would likely be predominant at $95.80.
The above assessment represents an aggregation of all sequences going back to January 2019. However, up until the close of Tuesday, UAL stock printed a specific, distribution-heavy 3-7-D sequence; that is, in the 10 weeks to Tuesday’s end, UAL printed three up weeks, seven down weeks, with an overall downward slope.
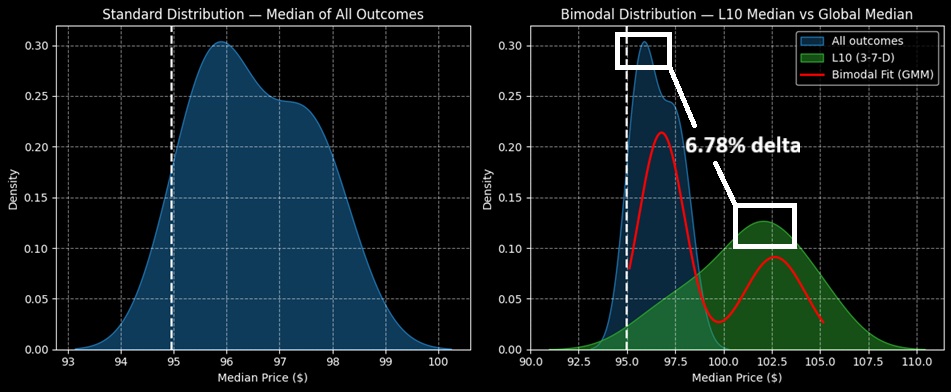
Under this condition, the fat-tail risk would extend to around $91. However, the fat-tail reward would jump past $110. What’s more enticing, price clustering would likely occur at $102.30. Essentially, there’s a 6.78% delta in density dynamics that technical and fundamental analysis is blind to.
To be quite blunt about it, that’s their problem, not yours. This variance is an informational arbitrage that you could potentially exploit.
For those who are mathematically curious, the reason this variance doesn’t show up in technical models is that market technicians are making assessments on a data sample of one. They see one pennant, one wedge, one support level and craft an entire narrative out of it. If you keep writing enough stories, the law of averages states that eventually, some of the calls will be correct.
On the other end, quant models run multiple trials — hundreds if not thousands of data points, depending on the security — and make assessments on the actual, empirical tendencies. That’s what separates quants from mere handwaving.
Identifying a Tempting Offer
With the market intelligence above, the idea that arguably makes the most sense is the 100/105 bull call spread expiring Dec. 19. This transaction involves buying the $100 call and simultaneously selling the $105 call, for a net debit paid of $245 (the most that can be lost).
Should UAL stock rise through the second-leg strike ($105) at expiration, the maximum profit is $255, a payout of over 104%. Further, the breakeven price is $102.45, which is a contextually realistic target given the aforementioned clustering effect. Also, while $105 is an ambitious target, it’s within the distributional curve of forward outcomes tied to the 3-7-D sequence.
Now, with UAL stock rising sharply on Wednesday, it’s on pace to print a 4-6-D sequence by the end of this week, which presents a different outlook. However, my argument is that traders historically view heavily distributive sequences as buying opportunities. Therefore, even if the 3-7-D flashed only briefly, past analogs suggest that — if the winds blow favorably — UAL has a solid chance of landing between $102.50 and $105.
On the date of publication, Josh Enomoto did not have (either directly or indirectly) positions in any of the securities mentioned in this article. All information and data in this article is solely for informational purposes. For more information please view the Barchart Disclosure Policy here.
More news from Barchart
- Supermicro Stock Slips 33% in a Month: Should You Buy, Sell, or Hold SMCI?
- United Airlines (UAL): Hidden Behind the Shutdown Deal is a Secret Informational Arbitrage Opportunity
- Should You Buy the Dip in Intellia Therapeutics Stock?
- Penn Entertainment Is Breaking up With ESPN in Sports Betting Deal. Should You Sell PENN Stock Here?


