ETFOptimize | High-performance ETF-based Investment Strategies

Quantitative strategies, Wall Street-caliber research, and insightful market analysis since 1998.


ETFOptimize | HOME
Close Window

What Are Wall Street Analysts' Target Price for Stryker Stock?

Valued at a market cap of $140.5 billion, Stryker Corporation (SYK) is a leading medical technology company that develops innovative products and solutions across orthopaedics, medical and surgical equipment, and neurotechnology. The Portage, Michigan-based company is known for its cutting-edge implants, robotic surgical systems, advanced hospital equipment, and life-saving devices. 

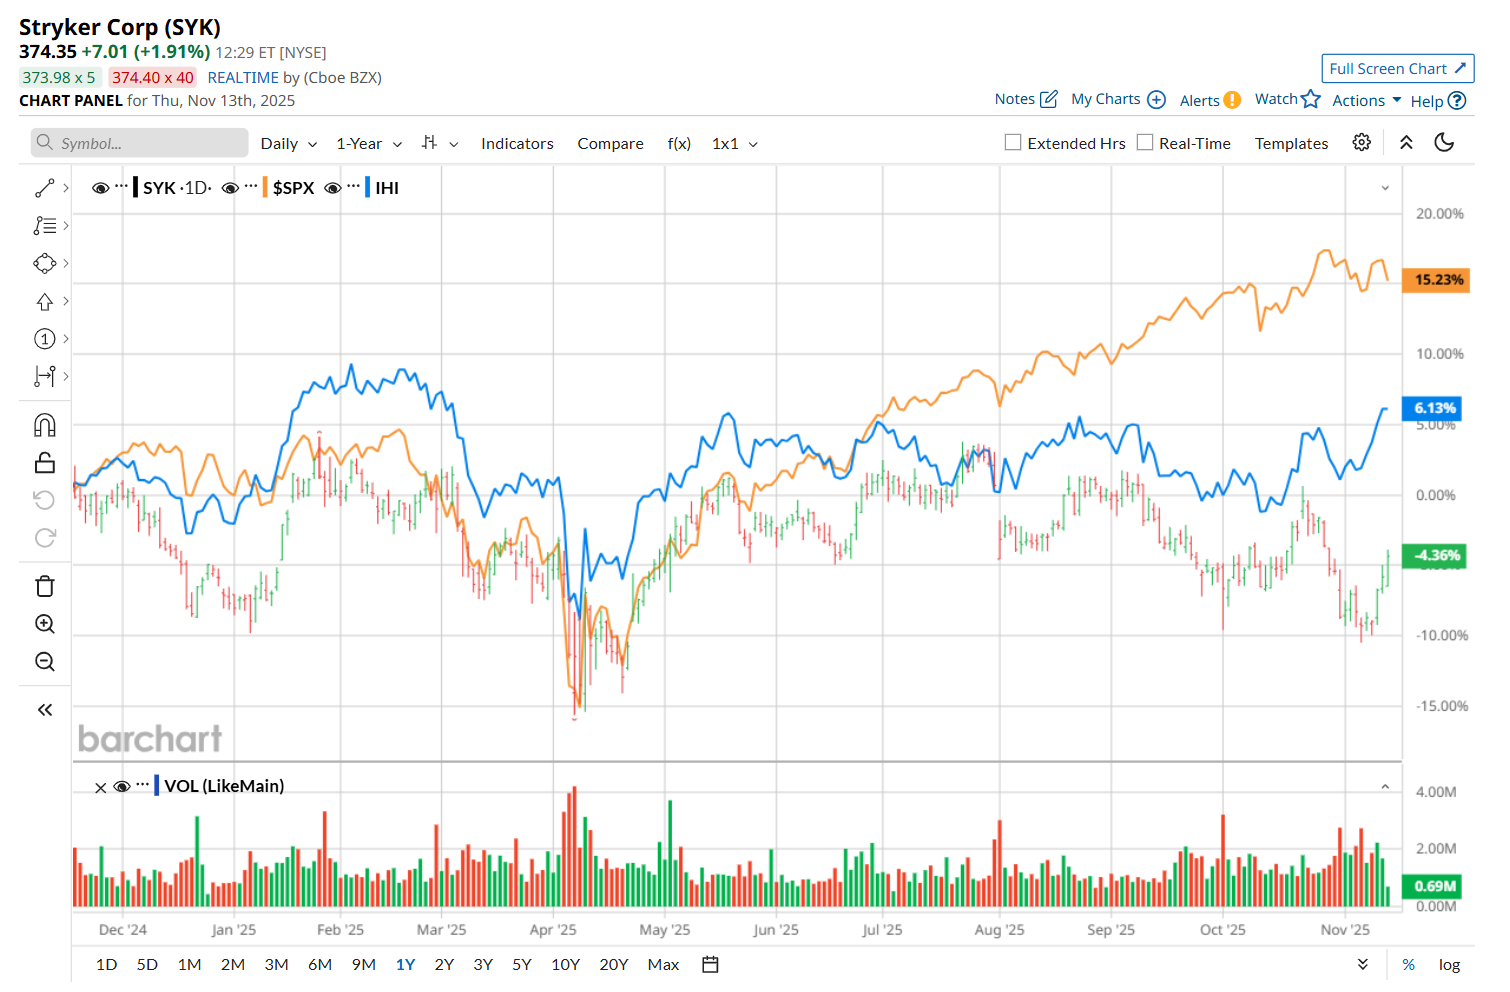
This healthcare giant has lagged behind the broader market over the past 52 weeks. Shares of SYK have declined 4.1% over this time frame, while the broader S&P 500 Index ($SPX) has gained 13.1%. Moreover, on a YTD basis, the stock is up 3.5%, compared to SPX’s 15.1% return.


Narrowing the focus, SYK has also underperformed the iShares U.S. Medical Devices ETF’s (IHI5.3% uptick over the past 52 weeks and 8.3% YTD rise. 

www.barchart.com

On Oct. 30, SYK posted better-than-expected Q3 results, yet its shares plunged 3.5% in the following trading session. On the upside, the company’s overall revenue improved 10.2% year-over-year to $6.1 billion and marginally surpassed the consensus estimates. Moreover, its adjusted EPS of $3.19 grew 11.1% from the year-ago quarter, topping analyst expectations of $3.14. Additionally, SYK raised its fiscal 2025 guidance, now expecting organic net sales growth of 9.8% to 10.2% and adjusted EPS to be between $13.50 and $13.60. 

However, investors appeared to focus on a decline in margins. The company's operating margin contracted to 18.7% from 19.7% recorded in the prior-year quarter, making investors jittery. 

For the current fiscal year, ending in December, analysts expect SYK’s EPS to grow 11.2% year over year to $13.56. The company’s earnings surprise history is promising. It exceeded the consensus estimates in each of the last four quarters. 

Among the 28 analysts covering the stock, the consensus rating is a "Moderate Buy,” which is based on 18 “Strong Buy,” two "Moderate Buy,” and eight "Hold” ratings.

www.barchart.com

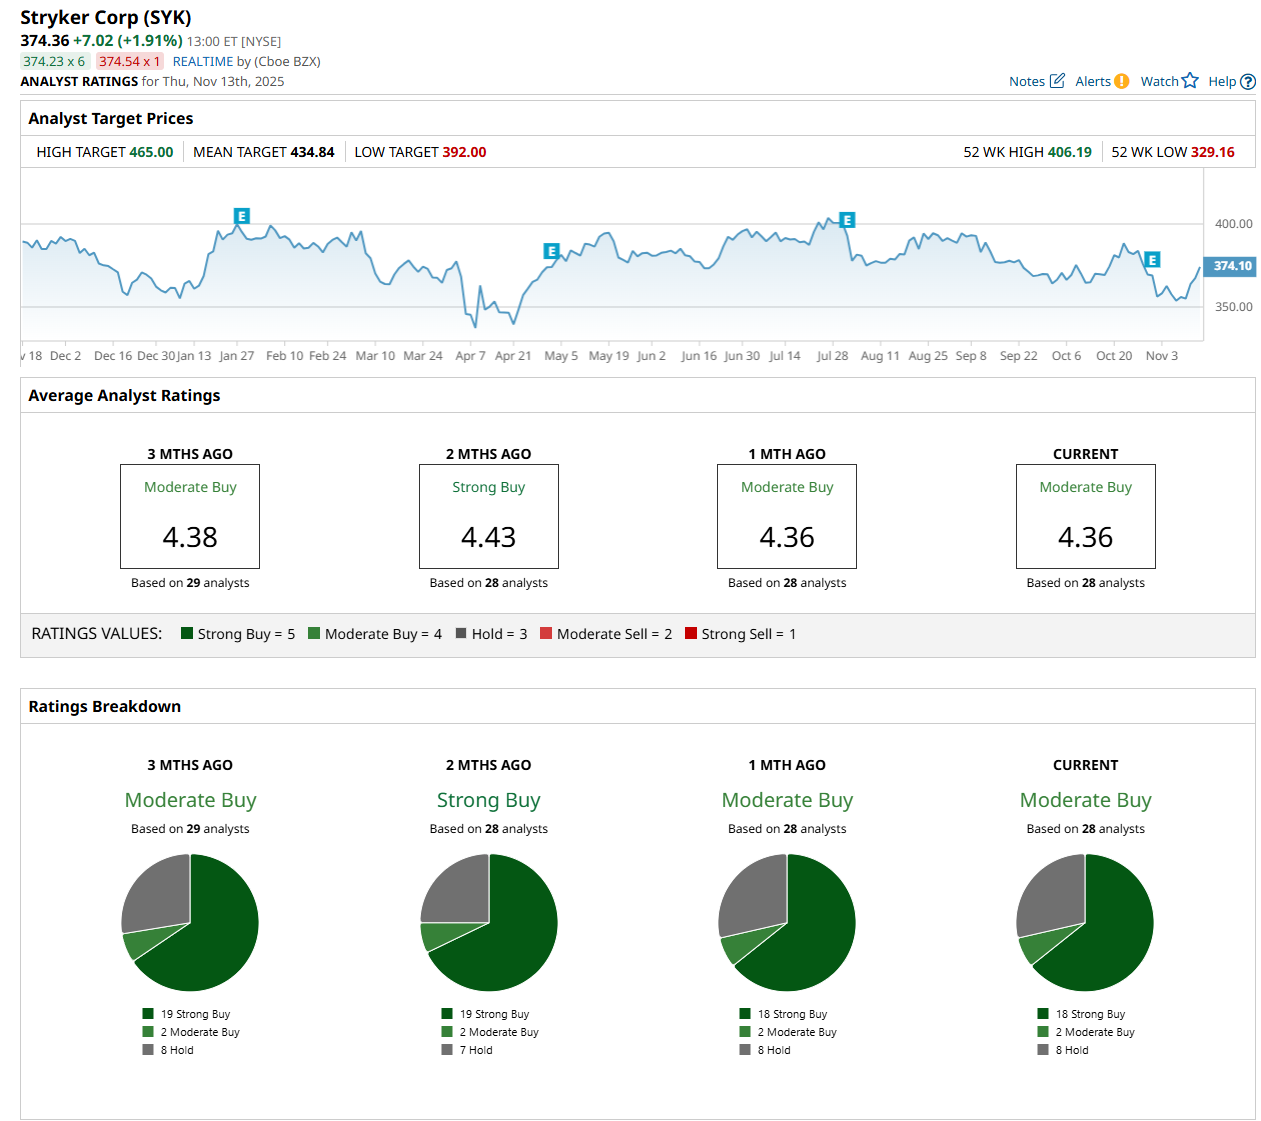
This configuration is slightly less bullish than two months ago, with 19 analysts suggesting a “Strong Buy” rating. 

On Nov. 10, Travis Steed from Bank of America Corporation (BAC) maintained a “Buy” rating on SYK, with a price target of $450, indicating a 20.2% potential upside from the current levels. 

The mean price target of $434.84 represents a 16.2% premium from SYK’s current price levels, while the Street-high price target of $465 suggests an ambitious 24.2% potential upside from the current levels. 


On the date of publication, Neharika Jain did not have (either directly or indirectly) positions in any of the securities mentioned in this article. All information and data in this article is solely for informational purposes. For more information please view the Barchart Disclosure Policy here.


More news from Barchart

Recent Quotes

View More
Symbol Price Change (%)
AMZN  217.14
+0.00 (0.00%)
AAPL  266.25
+0.00 (0.00%)
AMD  206.02
+0.00 (0.00%)
BAC  51.00
+0.00 (0.00%)
GOOG  289.98
+0.00 (0.00%)
META  589.15
+0.00 (0.00%)
MSFT  478.43
+0.00 (0.00%)
NVDA  180.64
+0.00 (0.00%)
ORCL  210.69
+0.00 (0.00%)
TSLA  395.23
+0.00 (0.00%)
Stock Quote API & Stock News API supplied by www.cloudquote.io
Quotes delayed at least 20 minutes.
By accessing this page, you agree to the Privacy Policy and Terms Of Service.


IntelligentValue Home
Close Window

DISCLAIMER

All content herein is issued solely for informational purposes and is not to be construed as an offer to sell or the solicitation of an offer to buy, nor should it be interpreted as a recommendation to buy, hold or sell (short or otherwise) any security.  All opinions, analyses, and information included herein are based on sources believed to be reliable, but no representation or warranty of any kind, expressed or implied, is made including but not limited to any representation or warranty concerning accuracy, completeness, correctness, timeliness or appropriateness. We undertake no obligation to update such opinions, analysis or information. You should independently verify all information contained on this website. Some information is based on analysis of past performance or hypothetical performance results, which have inherent limitations. We make no representation that any particular equity or strategy will or is likely to achieve profits or losses similar to those shown. Shareholders, employees, writers, contractors, and affiliates associated with ETFOptimize.com may have ownership positions in the securities that are mentioned. If you are not sure if ETFs, algorithmic investing, or a particular investment is right for you, you are urged to consult with a Registered Investment Advisor (RIA). Neither this website nor anyone associated with producing its content are Registered Investment Advisors, and no attempt is made herein to substitute for personalized, professional investment advice. Neither ETFOptimize.com, Global Alpha Investments, Inc., nor its employees, service providers, associates, or affiliates are responsible for any investment losses you may incur as a result of using the information provided herein. Remember that past investment returns may not be indicative of future returns.

Copyright © 1998-2017 ETFOptimize.com, a publication of Optimized Investments, Inc. All rights reserved.