Rochester, New York-based Paychex, Inc. (PAYX) provides integrated human capital management solutions (HCM) for payroll, benefits, human resources (HR), and insurance services for small to medium-sized businesses. With a market cap of approximately $40 billion, Paychex's operations span the United States, Europe, and internationally.
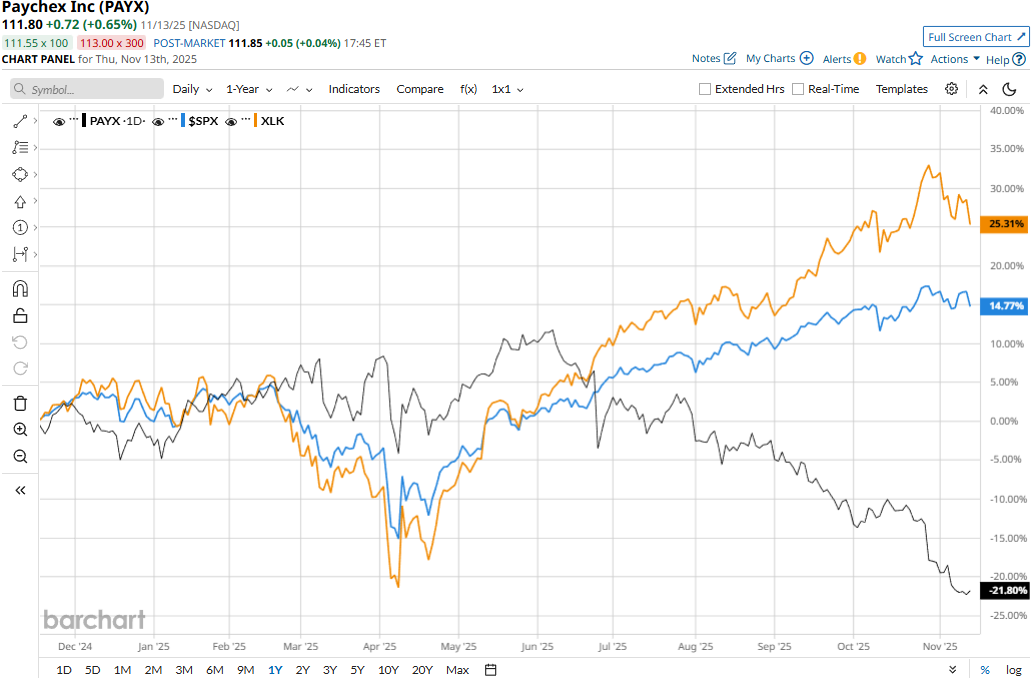
Paychex has significantly underperformed the broader market over the past year. PAYX stock prices have declined 20.3% on a YTD basis and 23.7% over the past 52 weeks, lagging behind the S&P 500 Index’s ($SPX) 14.6% gains in 2025 and 12.6% returns over the past year.
Narrowing the focus, Paychex has also underperformed the Technology Select Sector SPDR Fund’s (XLK) 23.3% gains in 2025 and 21.8% surge over the past 52 weeks.
Despite reporting better-than-expected results, Paychex’s stock prices declined 1.4% in the trading session following the release of its Q1 results on Sept. 30. Q1 marked a solid start to the fiscal year 2026, registering robust double-digit growth in revenues and cash flows. The company’s topline came in at $1.5 billion, up 17% year-over-year and 21 bps above the Street’s expectations. Meanwhile, its adjusted EPS grew 5% year-over-year to $1.22, exceeding the consensus estimates by 83 bps. Further, its cash flows from operations surged 31.6% year-over-year to $718.4 million.
On an even more positive note, the company raised its full-year adjusted EPS growth guidance range to 9% - 11%.
For fiscal 2026, ending in May, analysts expect Paychex to deliver an adjusted EPS of $5.47, up 9.8% year-over-year. Further, the company has a solid earnings surprise history. It has surpassed the Street’s bottom-line estimates in each of the past four quarters.
Among the 18 analysts covering the PAYX stock, the consensus rating is a “Hold.” That’s based on 15 “Holds” and three “Strong Sells.”
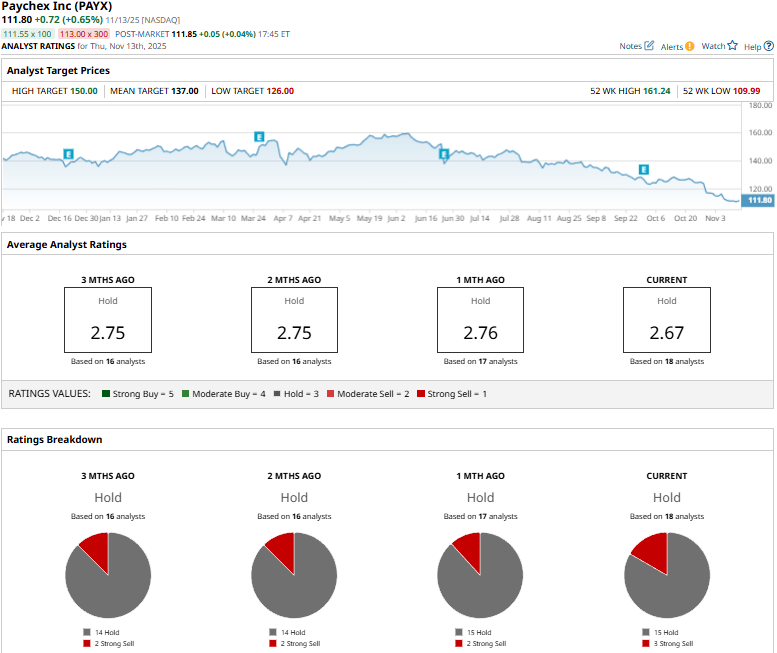
This configuration is slightly more pessimistic compared to a month ago, when two analysts gave “Strong Sell” recommendations.
On Oct. 20, Morgan Stanley (MS) analyst James Faucette reiterated an “Equal-Weight” rating on PAYX, and notched up the price target from $132 to $133.
Paychex’s mean price target of $137 represents a 22.5% premium to current price levels. Meanwhile, the street-high target of $150 suggests a notable 34.2% upside potential.
On the date of publication, Aditya Sarawgi did not have (either directly or indirectly) positions in any of the securities mentioned in this article. All information and data in this article is solely for informational purposes. For more information please view the Barchart Disclosure Policy here.
More news from Barchart
- Ray Dalio Warns the Next Big Debt Crisis Won’t Come From Banks. It’ll Come From Governments.
- This ‘Strong Buy’ Dividend Stock Yields 8%. Should You Add It to Your Portfolio?
- Who Is Phil Clifton? Michael Burry Names Successor as Famed Investor Deregisters Hedge Fund.
- Michael Burry Slams NVDA, PLTR, META, ORCL. Here’s What the Charts Say About His Tech-Focused ‘Big Short.’