The Hartford Insurance Group, Inc. (HIG), headquartered in Hartford, Connecticut, provides insurance and financial services to individual and business customers. Valued at $37 billion by market cap, the company offers products that include property and casualty insurance, group benefits, and mutual funds.
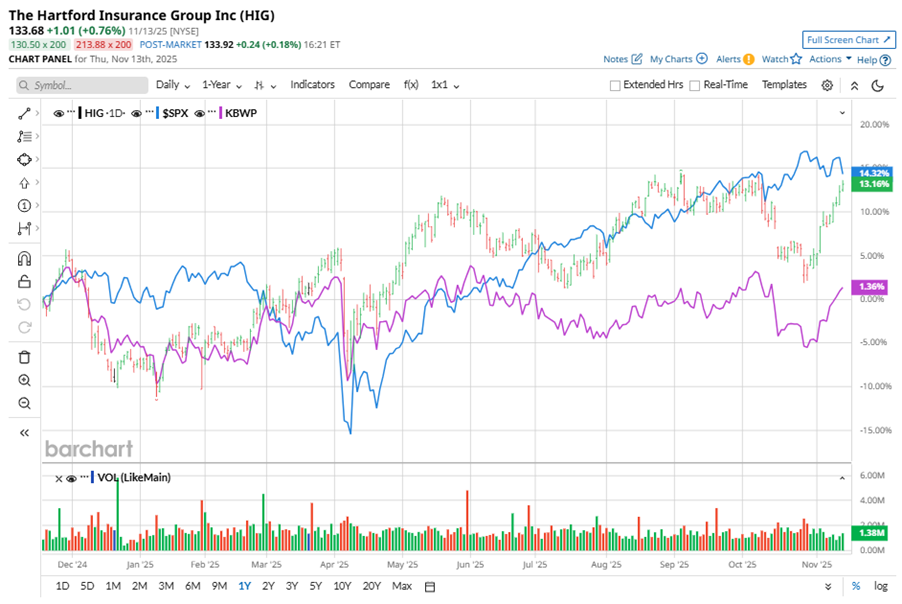
Shares of this insurance giant have outperformed the broader market over the past year. HIG has gained 13.6% over this time frame, while the broader S&P 500 Index ($SPX) has rallied nearly 12.6%. In 2025, HIG stock is up 22.2%, surpassing SPX’s 14.6% rise on a YTD basis.
Zooming in further, HIG’s outperformance is also apparent compared to the Invesco KBW Property & Casualty Insurance ETF (KBWP). The exchange-traded fund has gained about 2.1% over the past year. Moreover, HIG’s double-digit gains on a YTD basis outshine the ETF’s 6.5% returns over the same time frame.
HIG delivered a strong performance driven by robust growth in Business Insurance, particularly in small business and excess & surplus (E&S) lines, along with improved margins in Personal Insurance. The company's strategic investments in technology and underwriting discipline have enabled premium growth, with notable success in its small business franchise and digital initiatives. Despite challenges due to heightened competition and pressure on retention rates, HIG remains focused on leveraging digital capabilities and data science to enhance underwriting and customer experiences. The company is also expanding its agency platform and investing in transformative technology projects to drive future growth and efficiency.
On Oct. 27, HIG shares closed down marginally after reporting its Q3 results. Its revenue was $7.2 billion, beating analyst estimates by 1.2%. The company’s adjusted EPS of $3.78 exceeded analyst estimates of $3.21.
For the current fiscal year, ending in December, analysts expect HIG’s EPS to grow 19.9% to $12.35 on a diluted basis. The company’s earnings surprise history is impressive. It beat the consensus estimate in each of the last four quarters.
Among the 24 analysts covering HIG stock, the consensus is a “Moderate Buy.” That’s based on 10 “Strong Buy” ratings, two “Moderate Buys,” and 12 “Holds.”
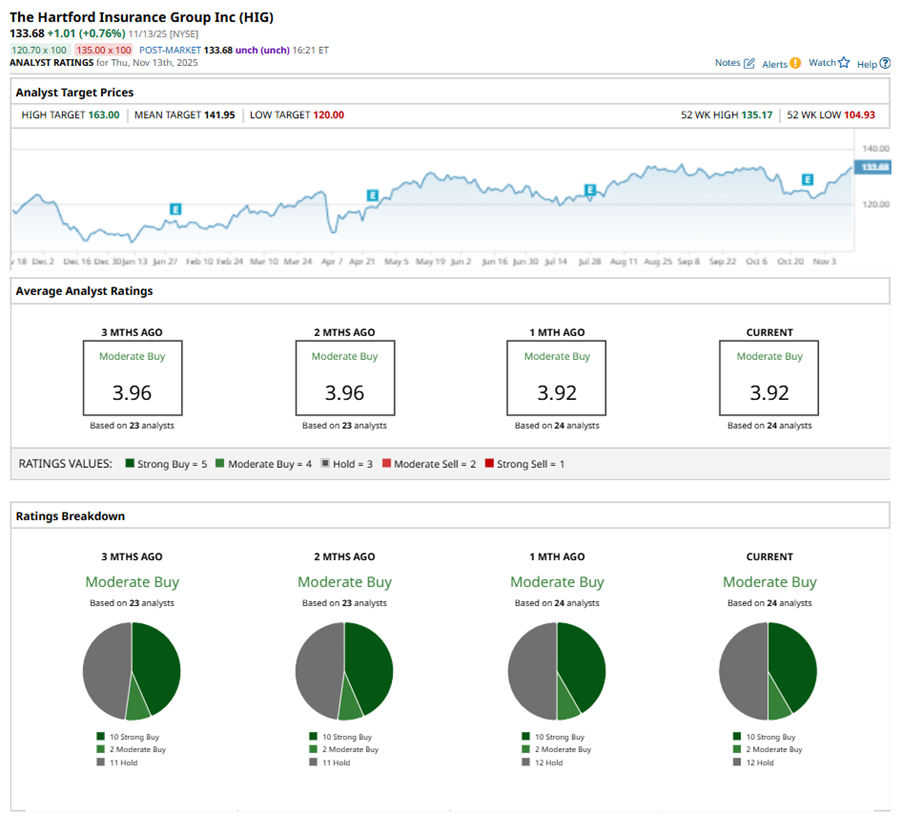
The configuration has been relatively stable over the past three months.
On Nov. 4, Keefe Bruyette kept an “Outperform” rating on HIG and raised the price target to $145, implying a potential upside of 8.5% from current levels.
The mean price target of $141.95 represents a 6.2% premium to HIG’s current price levels. The Street-high price target of $163 suggests an upside potential of 21.9%.
On the date of publication, Neha Panjwani did not have (either directly or indirectly) positions in any of the securities mentioned in this article. All information and data in this article is solely for informational purposes. For more information please view the Barchart Disclosure Policy here.
More news from Barchart
- Should You Buy the Post-Earnings Dip in Monday.com Stock?
- The ARKK ETF Is Leaking, and the Tech Stock Flood Could Reach Biblical Proportions. What Should You Do With Cathie Wood’s Fund Here?
- 1 Outperforming Growth Stock to Buy as the Government Shutdown Ends
- Stock Index Futures Plunge on Fed Rate-Cut Doubts and Valuation Concerns