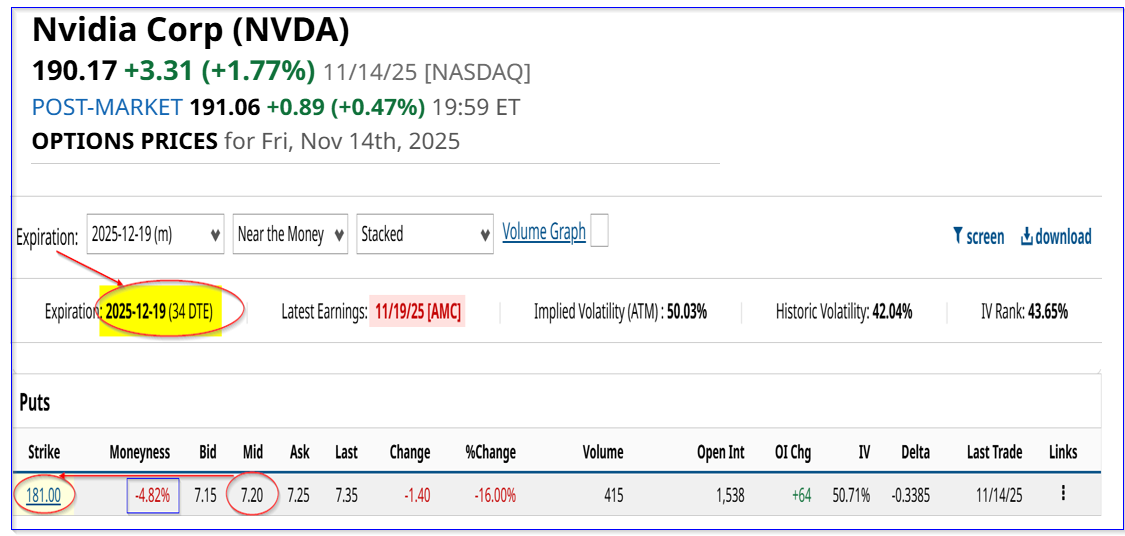
Nvidia, Inc.'s (NVDA) earnings and free cash flow for the quarter ending October are scheduled to be released after the market close on Wednesday, November 19. NVDA stock could be volatile ahead of the release. One way to play it is to sell short out-of-the-money puts to set a lower buy-in.
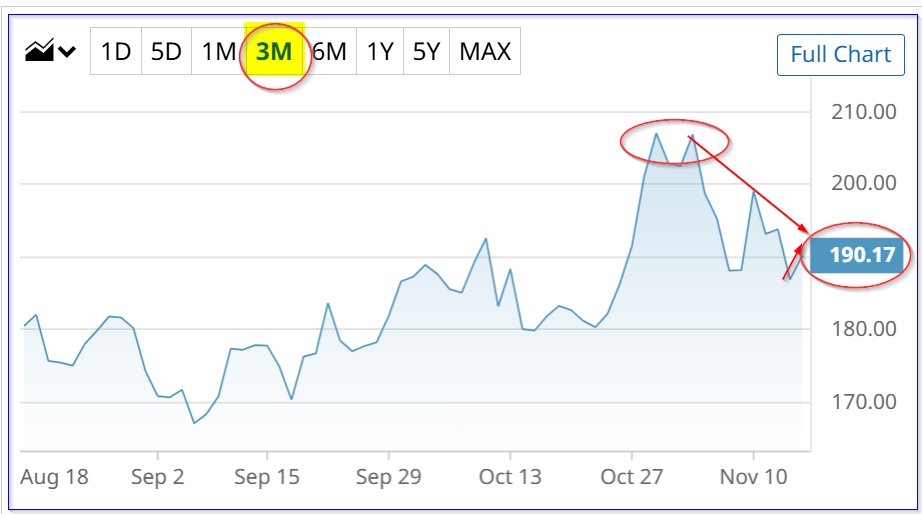
NVDA closed at $190.17 on Friday, Nov. 14. That is off a recent peak of $206.88 on Nov. 3, but still up from a low of $188.15 last Friday, Nov. 7.
But where could it go if earnings surpass analysts' expectations?
Setting a $230 Price Target
I discussed this in a recent Barchart article, “Nvidia Looks 22% Undervalued Here Based on Projected FCF Margins - $230 Price Target.”
I set a $230 price target based on expectations that Nvidia will make a 39.0% free cash flow (FCF) margin over the next year. I then divided this FCF estimate by a 2.0% FCF yield (the same as a 50x FCF multiple).
This is even though Nvidia's FCF margin last quarter, which ended Aug. 27, was just 28.8%. But its trailing 12-month (TTM) FCF margin was 43.59%, according to Stock Analysis.
So, I figured that, even if Nvidia makes a 28.8% FCF margin for Q3, its TTM figure would still be 39.15%.
That's why I used a 39% FCF margin to estimate the $230 price target.
Here's how that works. Analysts' revenue forecast for the year ending Jan. 2026 is $207.56 billion, and $290.11 billion for the year ending Jan. 2027.
So, on average, with one quarter left for 2026, the next 12-month (NTM) forecast averages $269.5 billion. The median between the NTM and the year ending Jan. 2027 forecast is $279.81 billion:
$279.81 b revenue x 0.3915 FCF margin = $109.5 billion FCF
And, multiplying this by 50x:
$109.5b x 50 = $5,475 billion market cap. That is +18.3% higher than Friday's market cap of $4,630 billion. In other words, the price target would be
1.183 x $190.17 = $224.97 price target
However, using the Jan. 2027 revenue of $290.11 billion results in a market cap of $6,527 billion, a price target 41% higher, or $268.05.
Setting a $230 price target is well within this $225 to $268 range, depending on which revenue and FCF margin is used.
So, if its Q3 FCF comes in higher than 29%, it's possible that we could reset a higher price target.
Obviously, there is no guarantee this could happen.
So, one way to conservatively play NVDA stock is to set a lower buy-in by selling short out-of-the-money (OTM) put options.
Shorting OTM NVDA Puts
A week ago, I suggested shorting the $170 put option expiring Dec. 12, 2025, for a premium of $4.60. That represented a one-month short-put yield of 2.71% (i.e., $4.60/$170.00) for a 9.7% out-of-the-money (OTM) put.
As of Friday, that premium had fallen to $3.30 at the midpoint. So, this has already been profitable for the short seller (i.e. $460-$330, or $130 on a $17K investment, or 0.76% in one week.
Moreover, this still represents an attractive yield of 1.94% (i.e., $330/$17,000) for the next 27 days. That strike price is 10.6% out-of-the-money.
In addition, a new investor can sell short the Dec. 19 expiry $181.00 put option contract for a midpoint premium of $7.20. That is done by entering a trade to “Sell to Open” this put contract.
Note that the strike price is 4.82% below Friday's close, but the short-put yield is almost 4.0% (i.e., $7.20/$181.00 = 0.039779 = 0.03978 = 3.978%). This is just 34 days until expiration.
Even if NVDA falls 4.8% to $181.00, the investor's breakeven point will be lower:
$181.00-$7.20 = $173.80 or -8.60% below Friday's close
Granted, the investor's secured cash of $18,100 will be used to purchase 100 shares at $181.00. But the investor will have already received $720. So, the next buy-in cost is
$18,100 - $720.00 = $17,380 for 100 shares
At that point, the investor could sell out-of-the-money calls, to reduce any unrealized capital loss. Moreover, the investor could repeat this trade each month. For example, if these premiums stay high, the expected 3-month short-put yield return is:
4% x 3 = 12%, or equivalent to a price target of $212.99 (i.e., $190.17 x 1.12)
So, this is a great way to set a lower buy-in point for an investment in NVDA stock and get paid while waiting for it to drop potentially.
On the date of publication, Mark R. Hake, CFA did not have (either directly or indirectly) positions in any of the securities mentioned in this article. All information and data in this article is solely for informational purposes. For more information please view the Barchart Disclosure Policy here.
More news from Barchart
- Nvidia's Earnings Report Will Be Out on Wednesday, Nov. 19 - How to Play NVDA Stock
- The Saturday Spread: Using Quant Analysis to Uncover the Best Discounts (PINS, XYZ, HPQ)
- Michael Burry Warned That the AI Bubble Is About to Burst. If You Agree, Use Options to Bet Against These 2 Stocks.
- These 3 Unusually Active Puts Deep ITM Offer Strategic Plays for Both Bulls and Bears


